What Is FRAMEGATE — And How Does LIZ Turn Political Discourse Into Evidence-Based Intelligence?
FRAMEGATE is a corpus-based research engine for Narrative Intelligence. In its current build, it operates on a curated U.S. discourse corpus (media outlets and political podcasts), computes hundreds of metrics across multiple analytical categories, and covers a multi-year time window (late 2022 to early 2026). Exact corpus counts, source lists, and metric catalogs are documented per release. LIZ is a dialogue interface that can render the same underlying analysis in role-appropriate formats (e.g., executive briefing, research summary, data export), while keeping outputs bound to the same computed evidence. LIZ is designed to answer questions using computed results from the curated corpus, with multiple verification steps that constrain and detect unsupported claims. Where evidence is weak or missing, the system is designed to surface caveats rather than improvise. This article explains how FRAMEGATE works, why it exists, and what it means for decision-makers in politics, business, media, and research.
Why Does FRAMEGATE Exist?
Alen Vukovic grew up during the Yugoslav Wars. As a child, he experienced firsthand what happens when narratives replace reality — when media framing, political rhetoric, and public discourse diverge so far from the truth that entire populations make catastrophic decisions based on distorted information. That experience left a permanent mark: a deep, visceral understanding that the stories a society tells itself are not background noise. They are the operating system. And when that operating system is corrupted, people suffer.
Decades later, on February 28, 2025, that childhood lesson returned with full force. On that day, Ukrainian President Volodymyr Zelensky sat down with President Donald Trump and Vice President J.D. Vance in the Oval Office — and what followed was a highly publicized and contentious Oval Office exchange that triggered substantial media coverage and international commentary. Zelensky appeared blindsided. Many outlets framed the exchange as unusually confrontational for a diplomatic setting.
Retrospectively, this type of event motivates a measurable question: whether discourse indicators changed in the weeks leading up to the meeting, and whether those changes were detectable across pools.
Alen Vukovic had read 20+ newspapers daily for years, followed political podcasts, tracked analyst commentary, and studied campaign dynamics across the Atlantic. He felt informed. Deeply, confidently informed. And yet — like almost everyone else — he had not seen it coming. Not the specific confrontation, but a trajectory that may have increased the probability of confrontation, as reflected in measurable discourse shifts: the months of escalating rhetoric, the shifting narrative frames around Ukraine in Trump's communications and Vance's public positioning, the slow realignment of Republican discourse from cautious support to open skepticism. Many relevant signals were distributed across sources and formats, making it difficult to reconstruct the full pattern from any single outlet or briefing.
If we had been properly informed — not in the sense of reading more, but in the sense of actually understanding the discourse architecture — the trajectory toward that Oval Office moment can be investigated as an early-signal question: whether measurable indicators shifted prior to the event, and whether such shifts generalize across cases.
That was the moment FRAMEGATE became inevitable. Not because the technology was ready. Because the need was undeniable.
The problem was not a lack of effort. The problem was structural. The media system is not built to inform you. It is built to produce journalism — to select, to frame, to interpret, to decide what matters. Every editor, every headline, every broadcast makes choices about what to include and what to leave out. That is not a flaw. That is the job description.
The result is what you might call the illusion of being informed. You know every headline. You can name every controversy. You recognize every talking point. But you do not know the counter-positions that never made it into your feed. You do not see the slow-moving trends building underneath the daily noise. You cannot identify the narrative shifts that will shape decisions 3 weeks from now. You miss the patterns that only become visible when you look at 93,000 texts instead of 20 articles.
That gap — between feeling informed and actually understanding the discourse architecture — is where FRAMEGATE was born. Not as a technology project. As an answer to a question shaped by a childhood in wartime and crystallized by an Oval Office confrontation: What would a system look like that actually informs you, rather than delivering the illusion of it?
The answer required building something that no newspaper, no think tank, and no consulting firm currently offers: a validated, reproducible, bias-controlled analytical engine that reads everything, forgets nothing, and delivers evidence instead of impressions.
What Is FRAMEGATE and Who Is LIZ?
FRAMEGATE is the engine. It is the data foundation, the analytical pipeline, the validation layer, and the quality control system. It holds 64 structured Parquet databases covering U.S. political and media discourse from December 2022 through February 2026 — and growing. Every text in this database has been analyzed across 461 individual metrics in 25 categories. Metrics and outputs are designed to be versioned and auditable. Validation results and traceability metadata are recorded per metric and per analysis run, enabling review back to document and source identifiers.
LIZ is the expert. She is the dialogue interface to this engine — a multi-talent agent who adapts to whoever is asking. LIZ is not a general-purpose conversational bot; she is an analysis interface constrained by the corpus, computed artifacts, and verification gates. She is not a search bar. She is not a dashboard with pre-built charts.
LIZ is a conversation partner who understands your question, navigates the entire database, applies the right analytical methods, and delivers exactly what you need — in the format you need it. Outputs are template-supported but parameterizable: the same evidence artifacts can be rendered as executive briefs, research summaries, or structured exports depending on user intent.
When you talk to LIZ, you talk to someone who can query and aggregate across the full corpus, retrieving the relevant subsets and computed metrics on demand, and cross-reference patterns across 3 years of discourse data in seconds.
The 5 Guarantees
Client-oriented outputs. Analyses can be rendered as briefings, reports, or datasets, depending on the use case — whether that is a 2-page executive briefing or a deep statistical analysis across 14 variables.
Evidence-bound by design. Reported numbers and claims are intended to be tied to computed artifacts and traceability metadata, enabling audit back to documents and sources. Nothing is generated from thin air.
Corpus-constrained sourcing. LIZ references only the curated corpus configured for FRAMEGATE analyses, rather than uncontrolled internet sources. No Wikipedia. No Reddit. No content farms. Every source has been selected, scored, and documented across ideology, geography, media type, reach, and urban-rural distribution.
Reliability by architecture. Reliability is addressed through deterministic computation, schema validation, and post-generation gates that are designed to catch mismatches before outputs are published. The architecture constrains generative steps and uses verification gates to detect and prevent unsupported statements from propagating.
Statistically validated. Reliability is assessed using inter-rater and test–retest style procedures appropriate to metric type (e.g., kappa-family measures for categorical outputs). A large majority of categorical fields exceed pre-defined agreement thresholds (e.g., κ ≥ 0.75). A composite confidence score is computed from these reliability results; its definition and thresholds are documented in the validation appendix.
How Does a Conversation With LIZ Look?
The best way to understand what LIZ does is to see her in action. The following screenshots show a real analytical session — from the initial question to the running pipeline. What you see is the current MVP (Minimum Viable Product): a Python-based terminal interface. This is the analytical engine in its raw form. A dedicated user interface is in development — but the intelligence underneath is already fully operational.
Step 1: The User Asks a Question
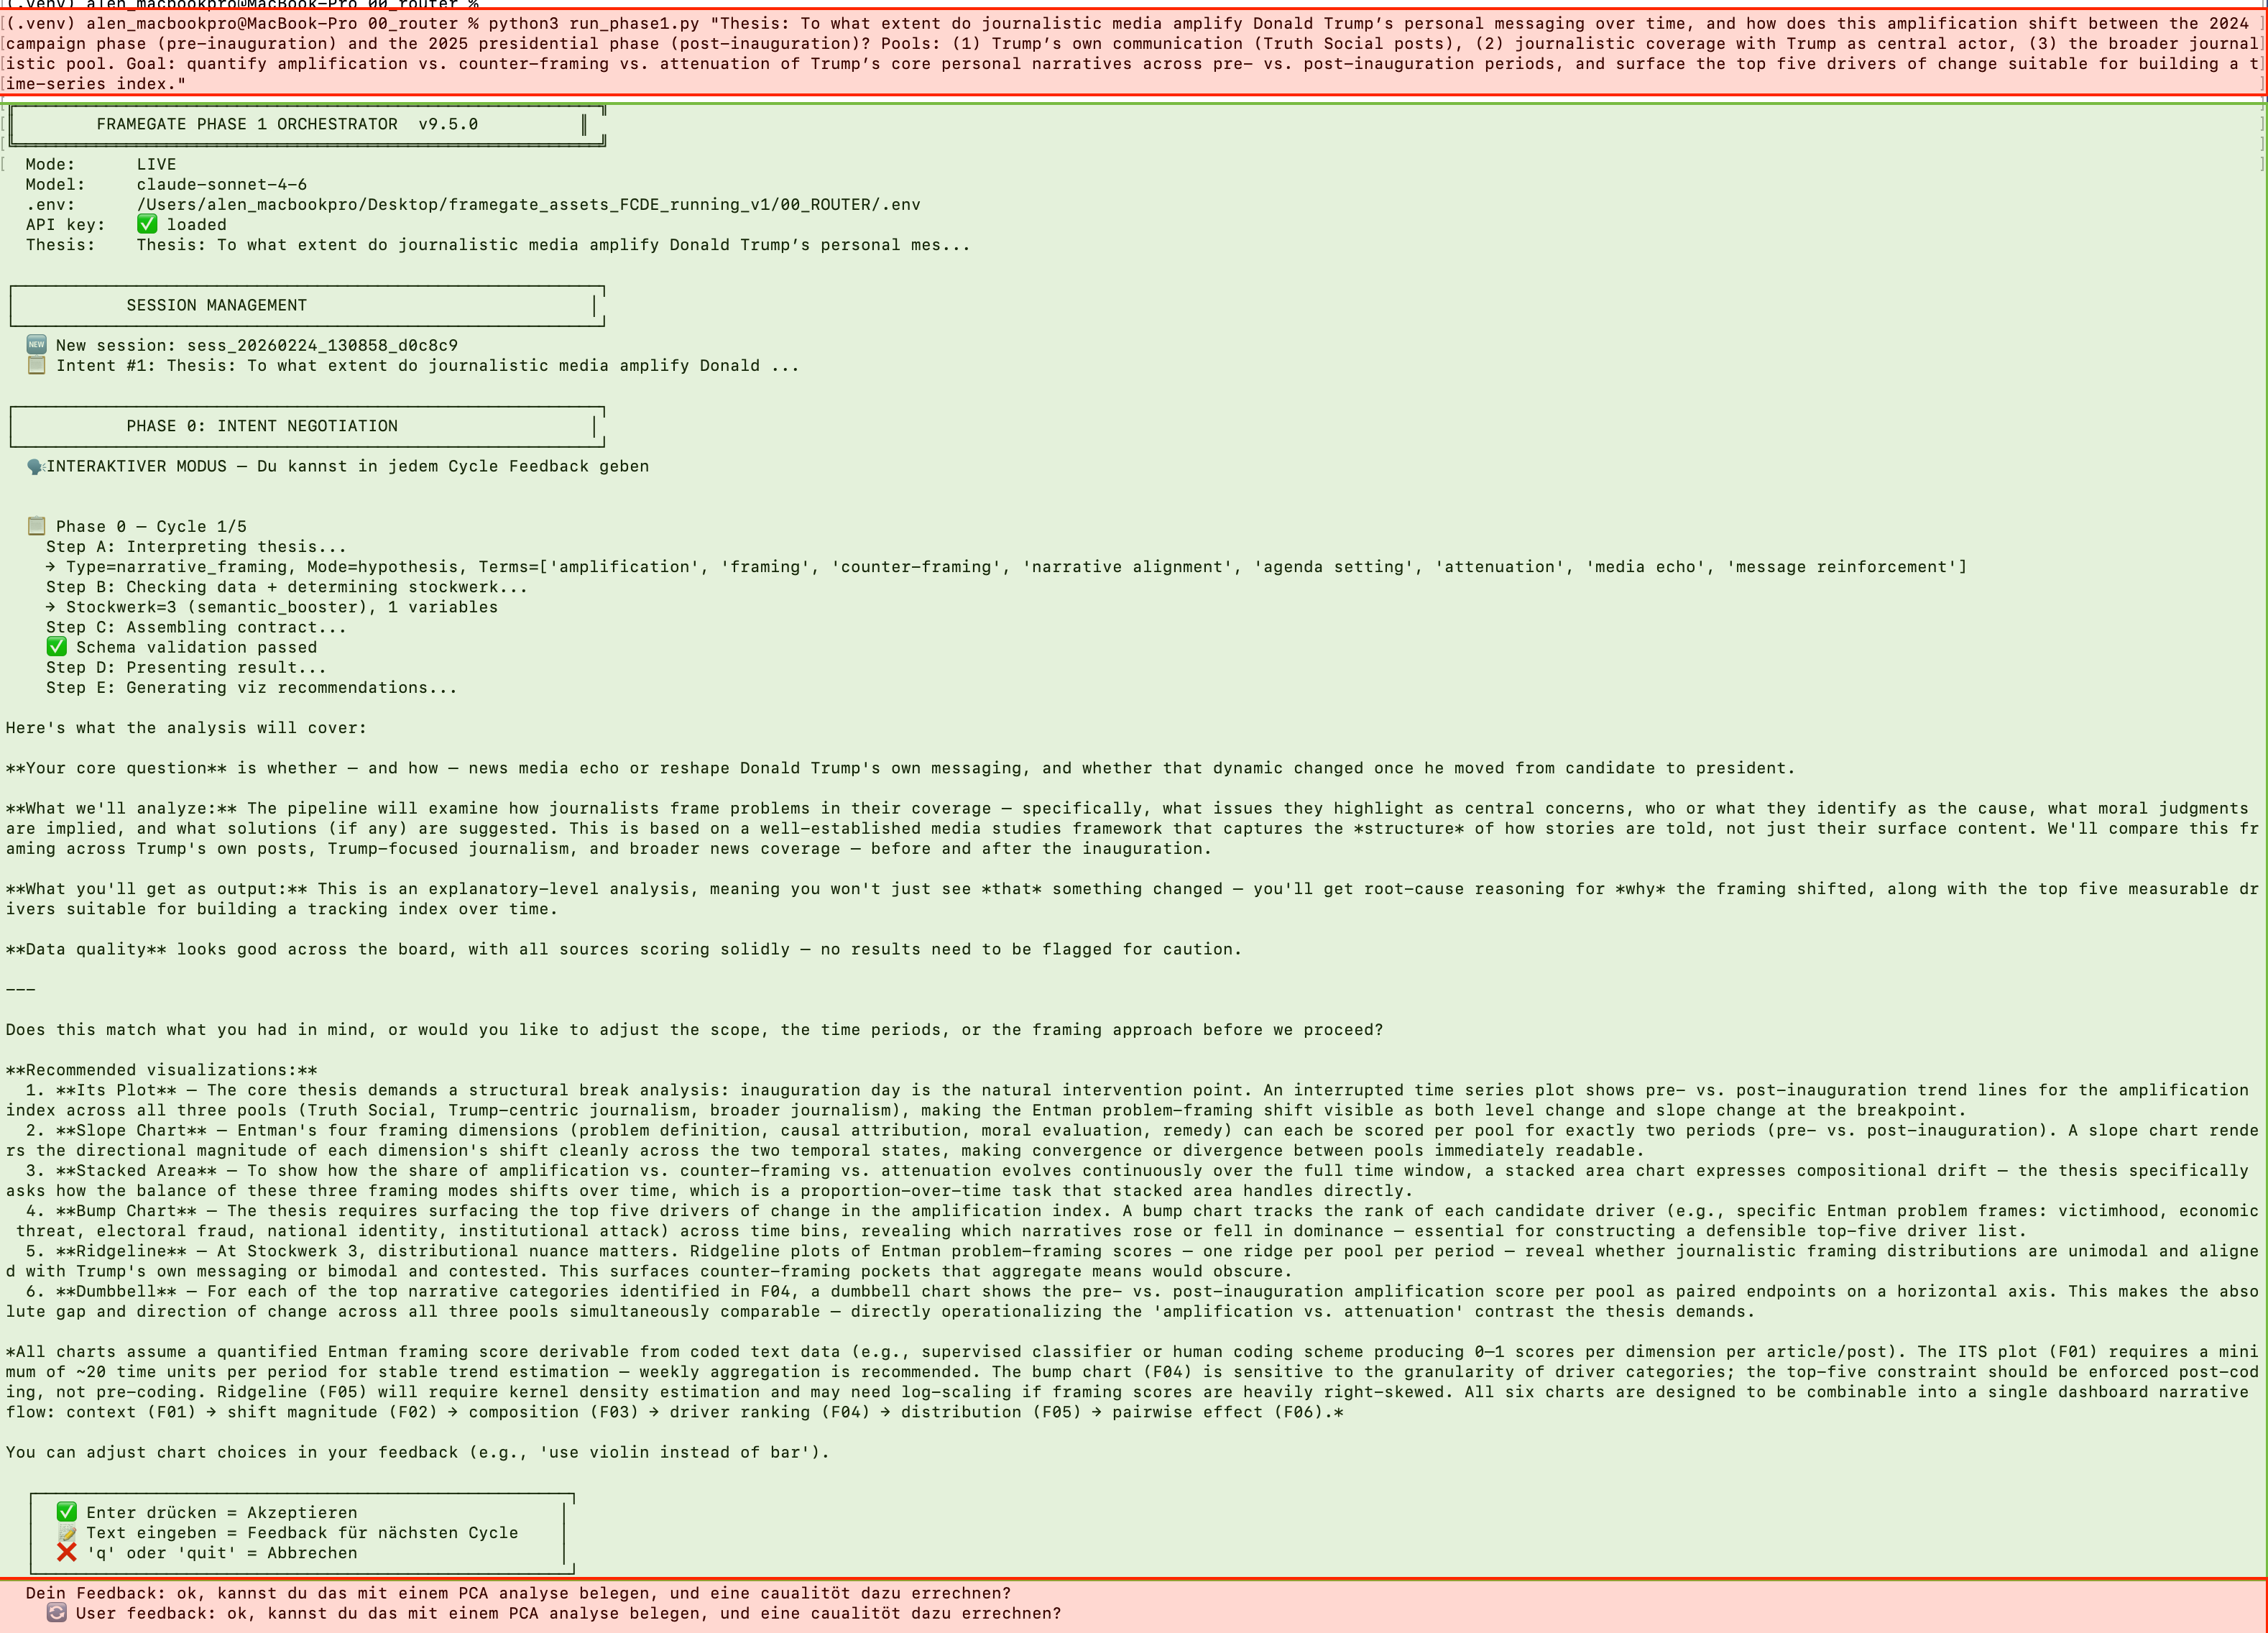
Red text = User input. Green text = LIZ response. The user types a research question — with typos and informal language, exactly as you would in a real working session. LIZ does not need polished academic prose. She understands the intent behind the words and immediately begins structuring the analysis.
Notice what happens in this first cycle: The user submits a thesis about how journalistic media amplify Trump's personal messaging. LIZ does not simply start analyzing. She first interprets the question, identifies the core research angle, determines which data pools and variables are relevant, suggests 6 specific visualizations, and explains what each one will reveal.
The intentional typos in the user input are not a mistake in this documentation — they demonstrate a key feature. LIZ works with natural, informal language. You do not need to formulate a perfect research hypothesis. You write what you think, and LIZ translates it into a structured analytical plan.
The response follows a clear architecture: (1) core question reformulated, (2) analytical method explained, (3) variables and data sources identified, (4) data quality checked, (5) specific visualizations proposed with explanations of what each reveals, (6) feedback requested. This is not a chatbot response. It is a structured negotiation between researcher and engine.
Step 2: The User Refines — LIZ Adapts
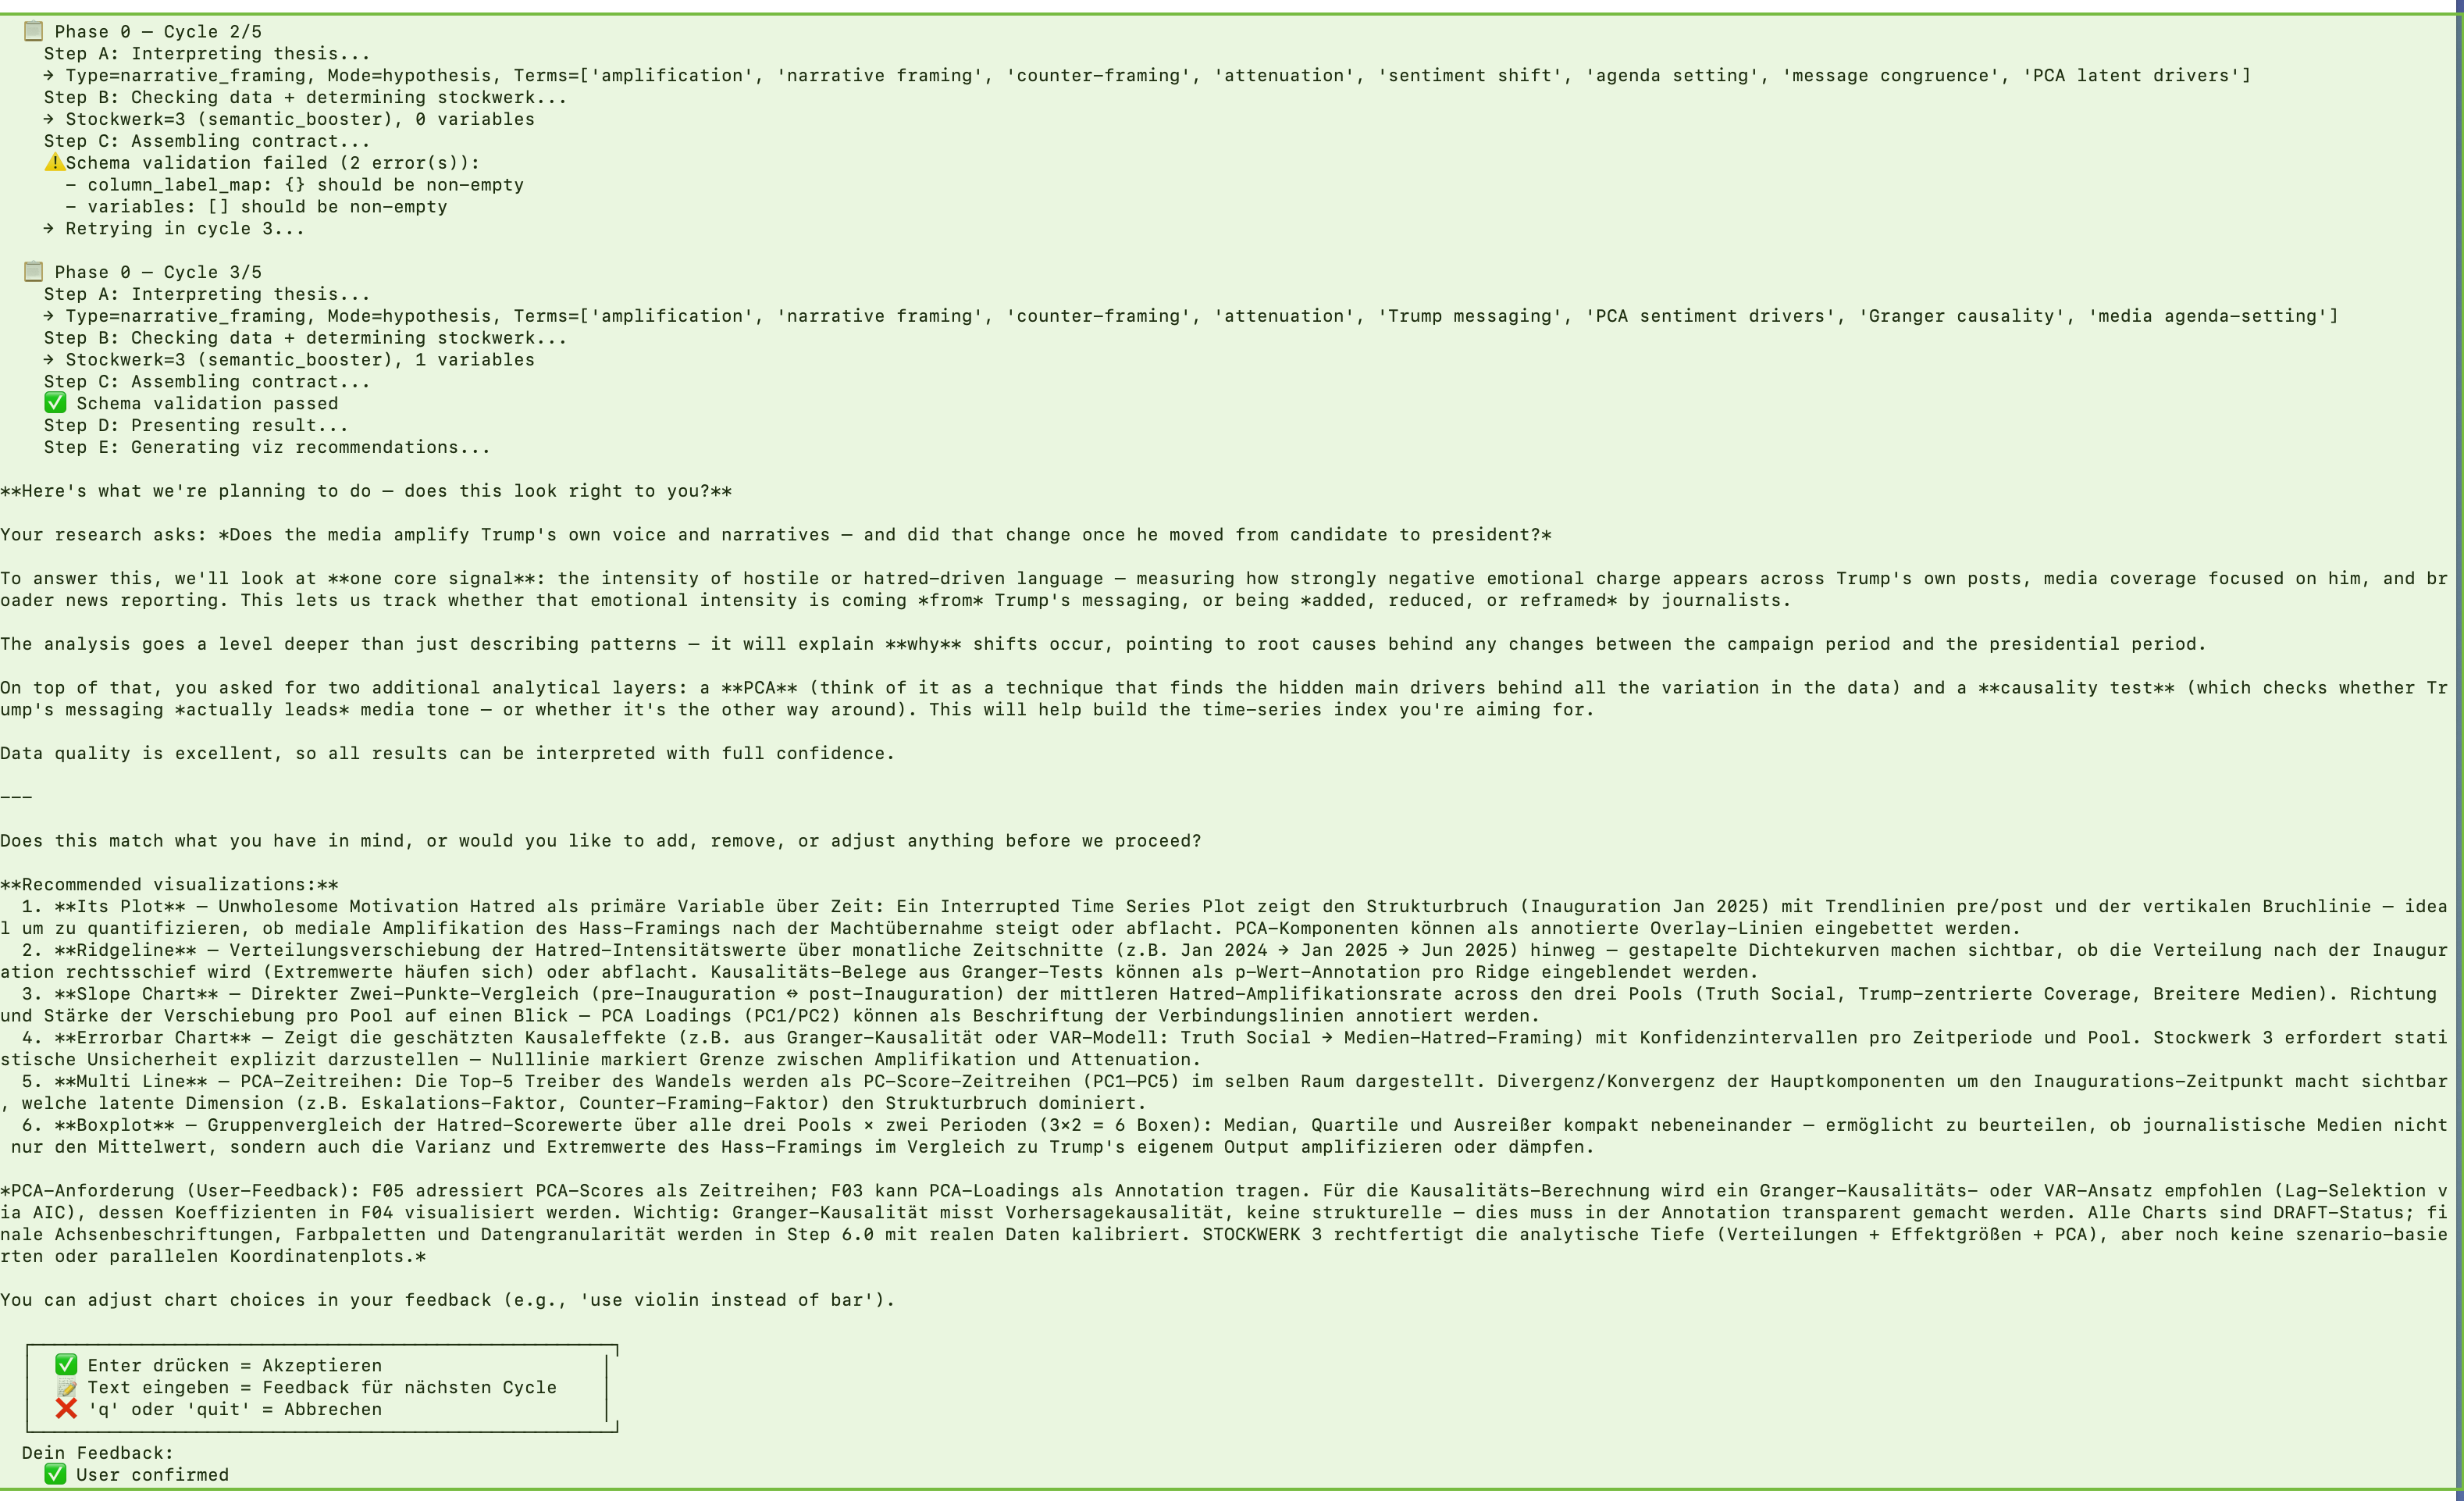
Cycle 2: Schema validation catches a structural issue — LIZ self-corrects automatically without user intervention. Cycle 3: The user requests additional analytical depth: PCA components and Granger causality testing. LIZ integrates both methods into the analysis plan and presents the updated approach for confirmation.
This is the interactive negotiation at work. The user is not locked into the first proposal. They can request changes, add methods, shift the focus — and LIZ adapts the entire analysis plan accordingly. In Cycle 2, a schema validation error is caught and repaired automatically. This is the self-correcting quality assurance running in real time. In Cycle 3, the user adds PCA (Principal Component Analysis) and Granger causality to the plan. LIZ does not just add them — she restructures the visualization plan to incorporate these methods meaningfully.
After up to 5 negotiation cycles, the user confirms the plan. Only then does the pipeline begin executing — with a fully agreed research design, validated data sources, and a clear analytical roadmap.
Step 3: The Pipeline Executes — 93 Steps to Evidence
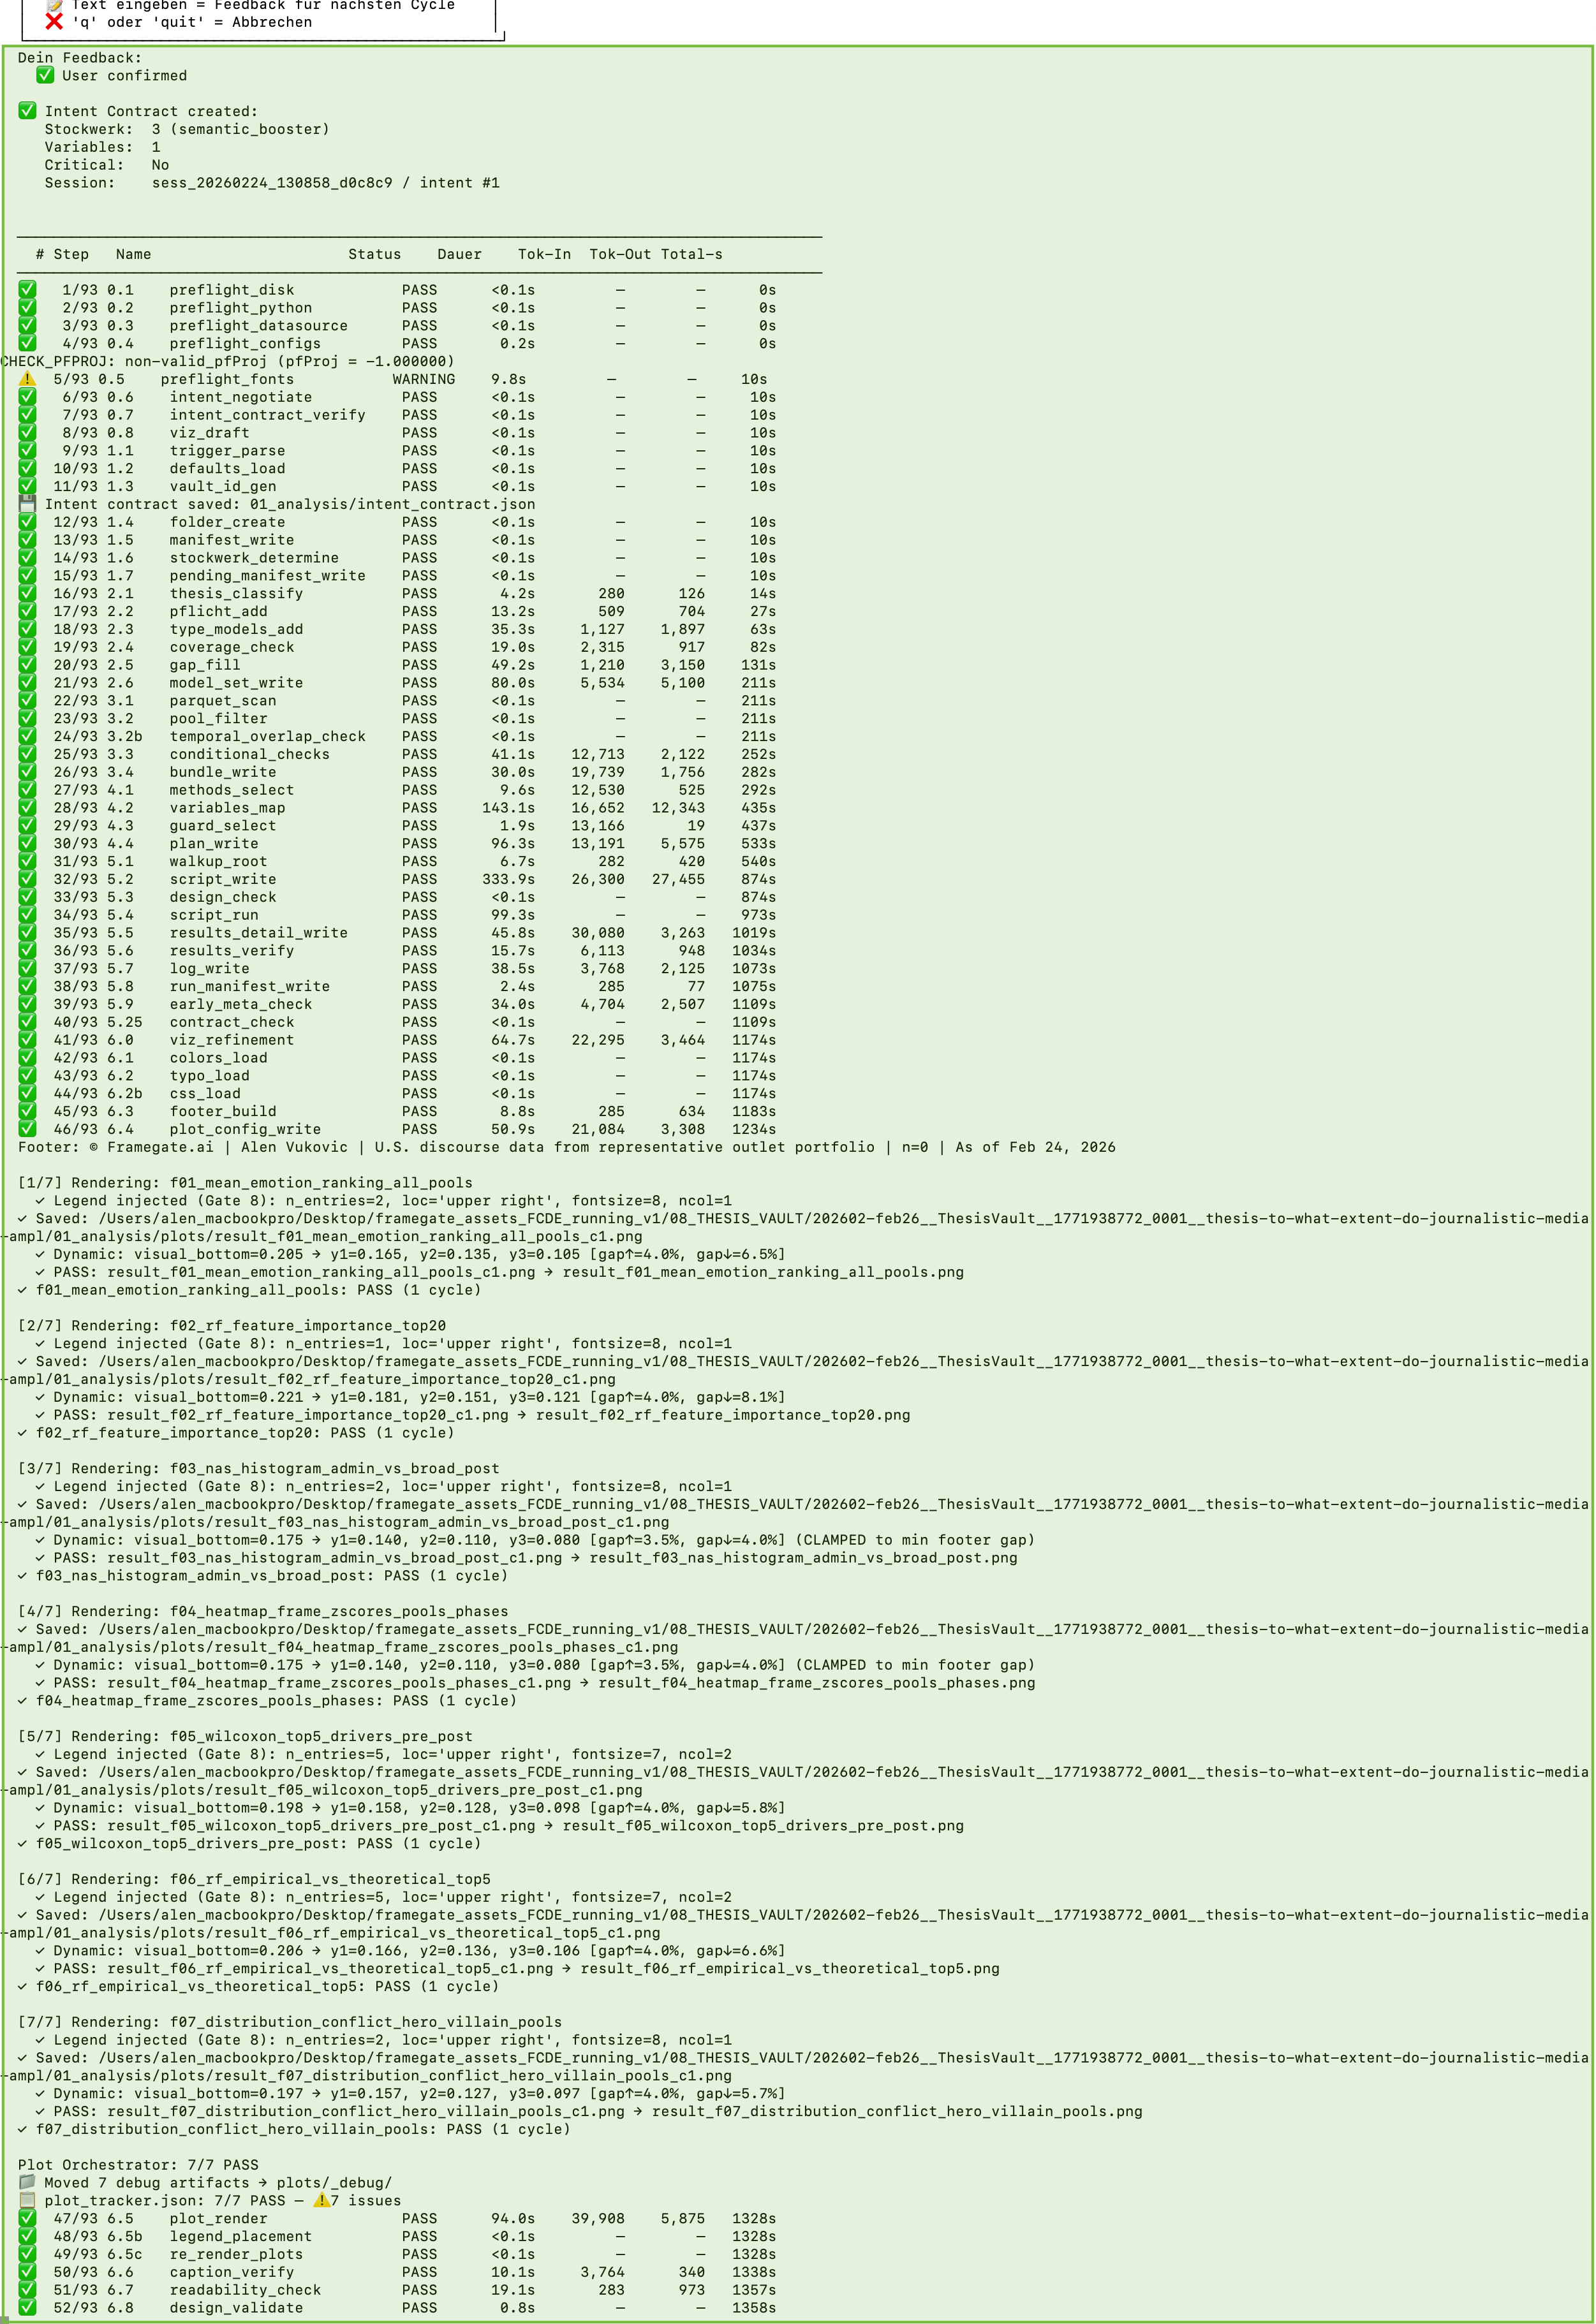
Every step is tracked. The telemetry table shows all 93 pipeline steps with their status (PASS/FAIL), execution time, token usage, and output size. Below: the rendering process generates publication-quality visualizations, each verified through a 12-gate quality pipeline.
Once the user confirms the analytical plan, the FRAMEGATE engine takes over. In the current pipeline configuration, an analysis run executes a multi-step workflow in strict sequence — from data loading and statistical computation through visualization rendering to the final quality gate. Every step is logged with its status, duration, and output. A substantial portion of these steps are fully deterministic (zero AI involvement). The remaining steps use AI-augmented analysis with constrained generation and verification safeguards at every stage. Step counts and gate definitions are logged in telemetry for each run.
The telemetry table you see is not decoration. It is the audit trail. Every client can verify exactly which steps ran, how long they took, and what they produced. The telemetry log provides an audit trail for each run (steps, status, runtime, and artifact outputs), enabling internal and client-facing review.
Step 4: Quality Gates, Automatic Stop, and the Finished Output
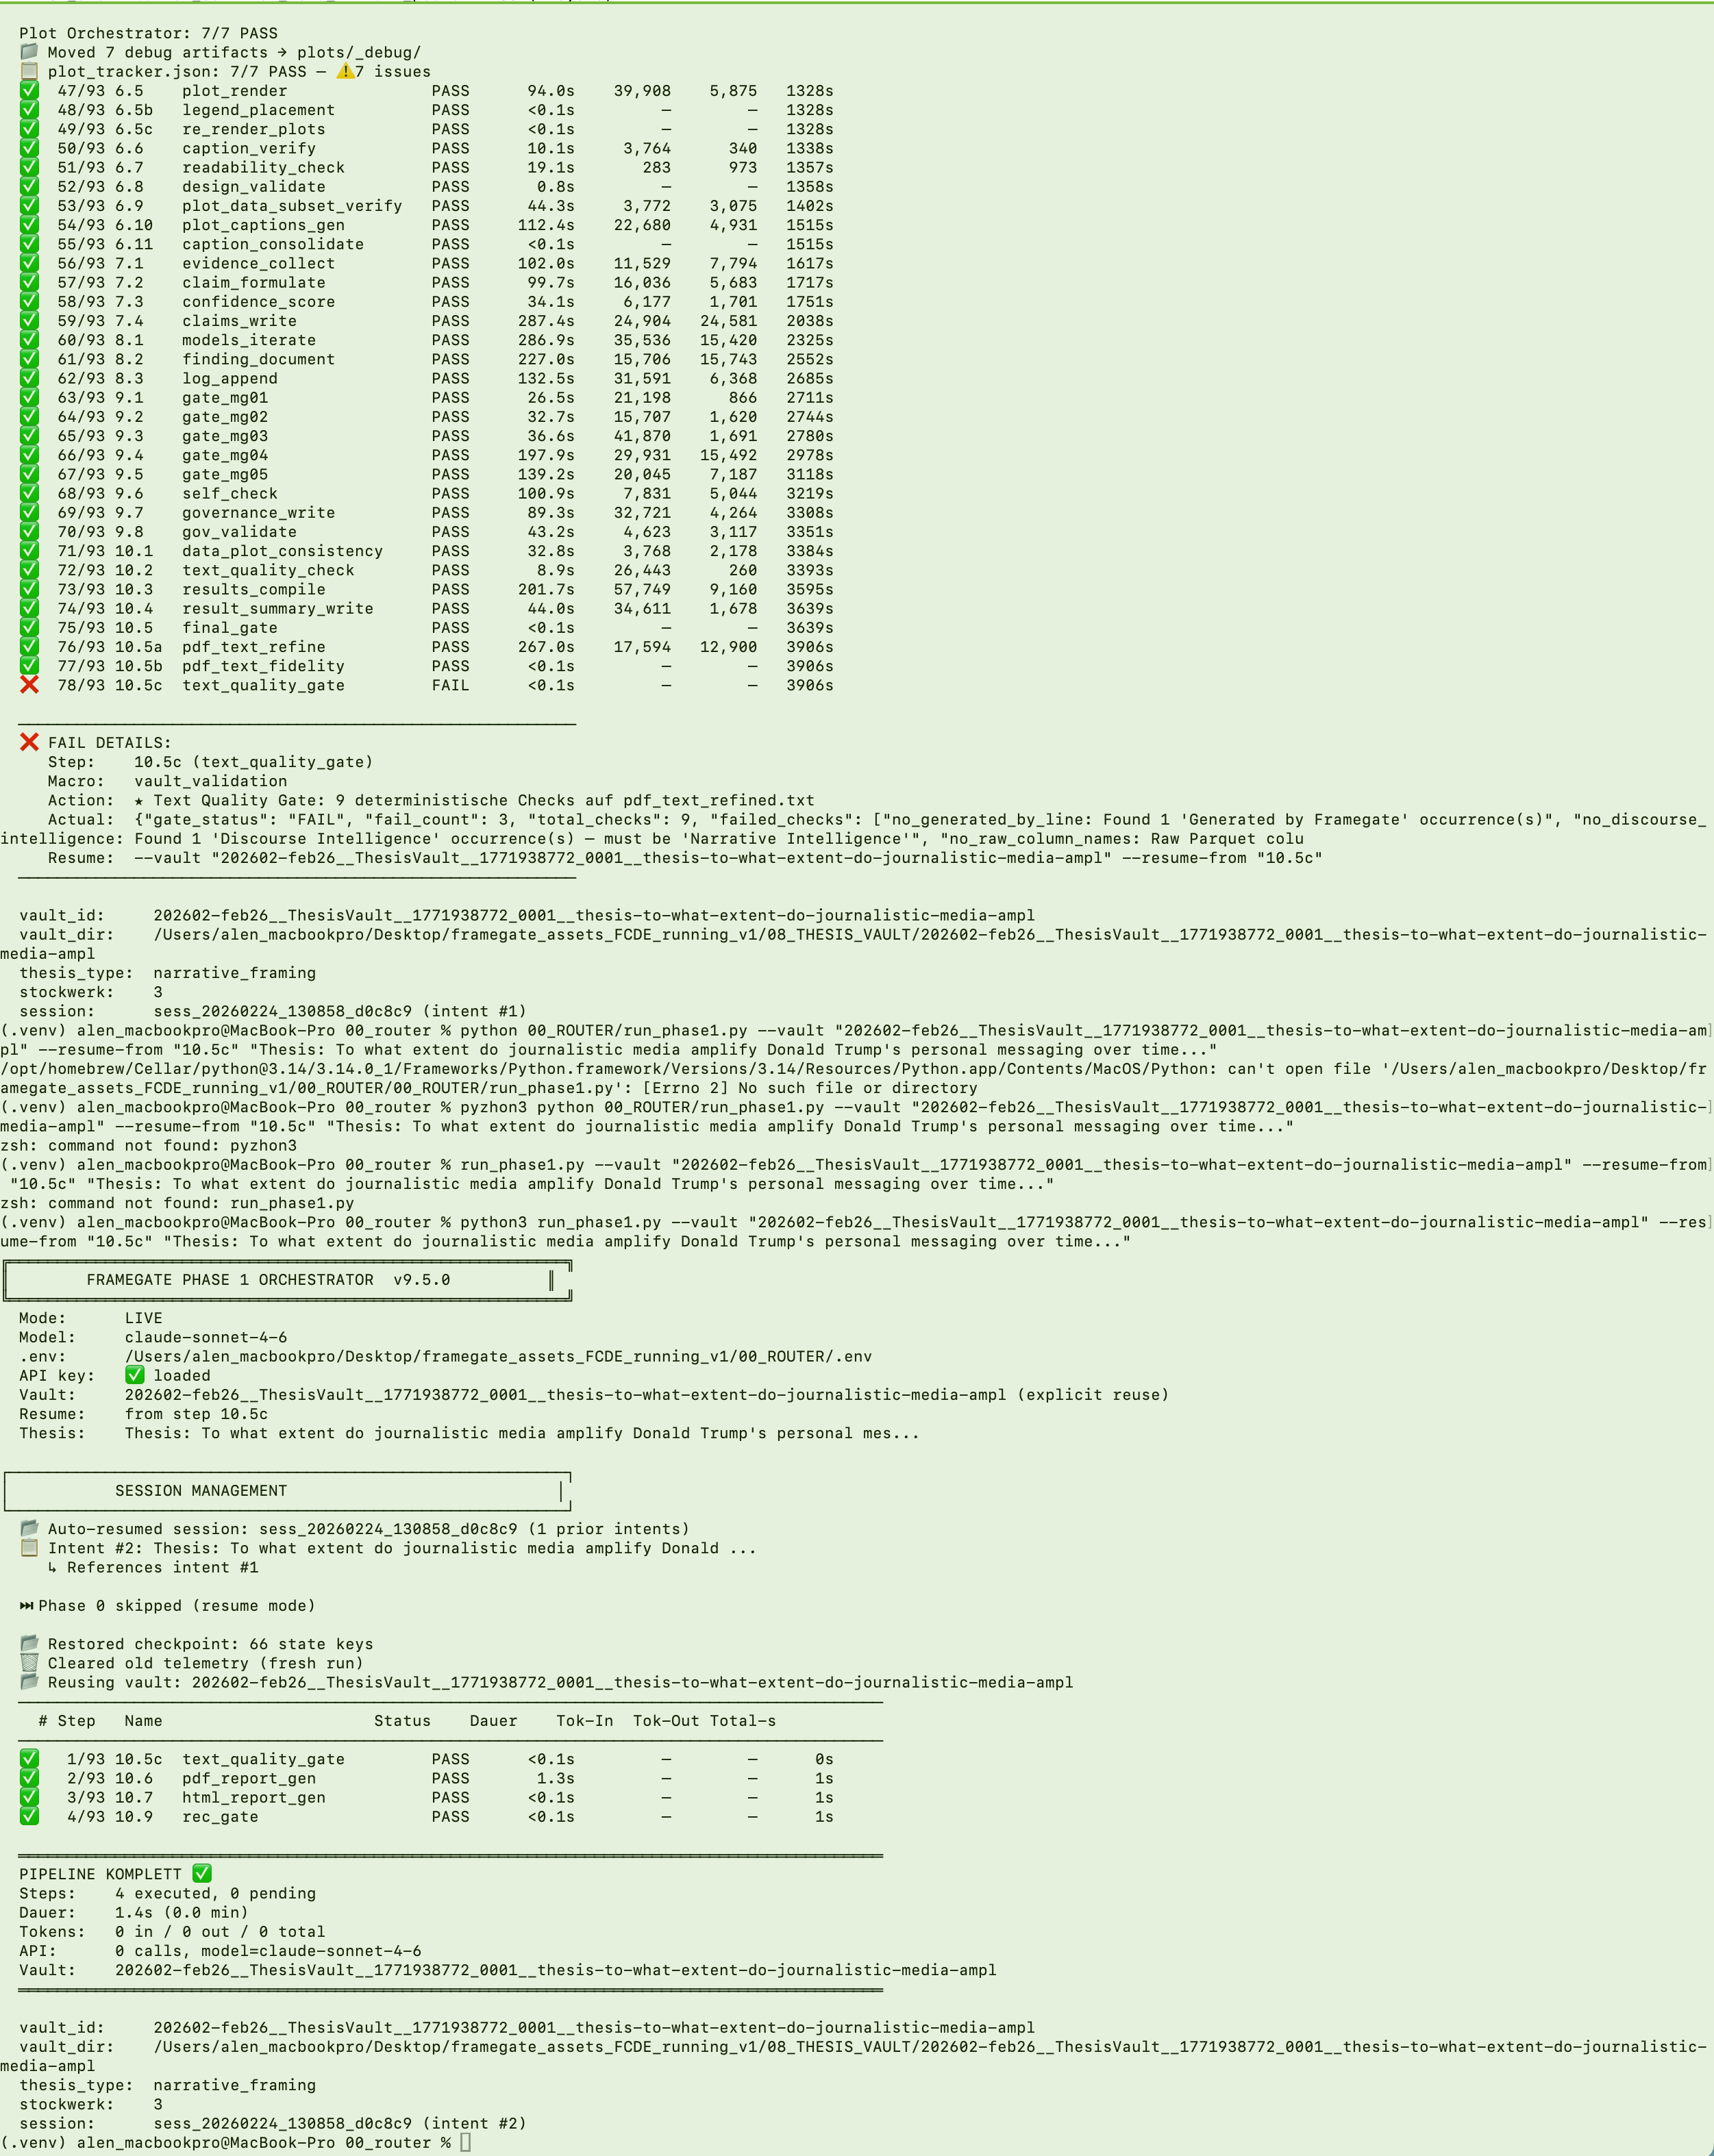
The pipeline protects its own output quality. At Step 10.5c, the Text Quality Gate — a deterministic checkpoint with 9 automated checks — detected 3 violations: an unauthorized attribution line, a deprecated term, and a raw database column name that should have been replaced with its publication-safe display name. The pipeline is designed to stop on violations detected by deterministic gates, preventing non-compliant text from being published downstream. After the fix, the pipeline resumed from the exact checkpoint and completed successfully — producing a downloadable PDF report and a publish-ready HTML article.
This is what "hallucination reduction by architecture" looks like in practice. The pipeline does not trust its own AI-generated text. It verifies it — deterministically, with zero AI involvement in the verification step. If the text fails even one of the quality checks, the pipeline is designed to stop. No PDF is generated. No HTML is published. The problem must be fixed before the engine continues.
The timestamp in the telemetry table tells the full story: 65 minutes of total execution time, 93 steps tracked to the second, and a quality gate that caught what a human reviewer might have missed. After the fix, the pipeline resumed from the exact checkpoint — no re-computation of earlier steps, no wasted time or API cost.
The finished output is twofold. First: a publication-quality PDF report, available for download — a self-contained document with all findings, visualizations, statistical evidence, and methodology documentation. The PDF page itself is not displayed in the terminal; it is generated as a file ready for distribution. Second: an HTML article, automatically published to the research website. Both formats read from the same verified source text — the single source of truth that passed all quality checks. Any other output format (PowerPoint, Excel, JSON, CSV, Parquet) can be generated from the same validated data on request.
Step 5: The Finished Report — What the Pipeline Produces
After approximately 40 to 65 minutes of pipeline execution, the system produces a self-contained PDF report. The following screenshots show the actual output of a completed analysis run.
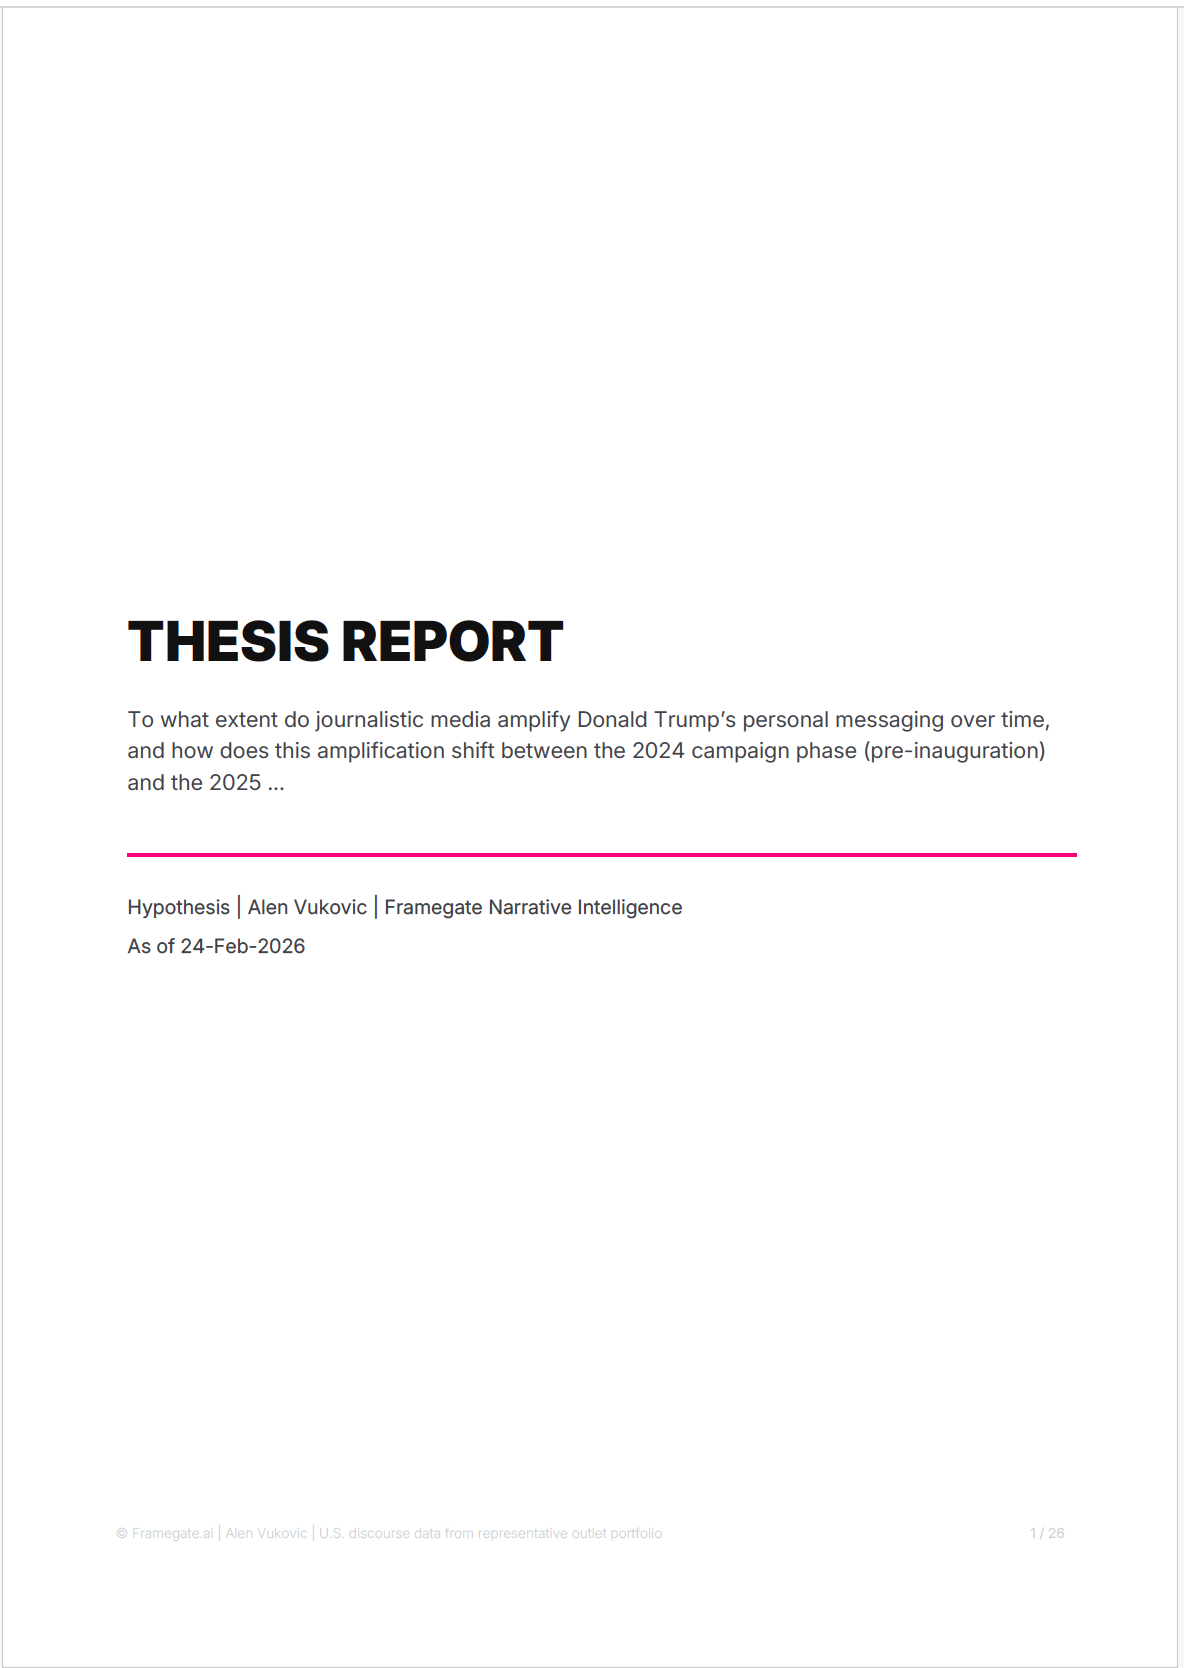
The cover page of a completed FRAMEGATE analysis. It states the research question (here: the extent to which journalistic media amplify Trump's personal messaging across pre- and post-inauguration phases), the author, and the production date. The report is 26 pages long and was generated entirely by the pipeline — no manual formatting, no post-processing.
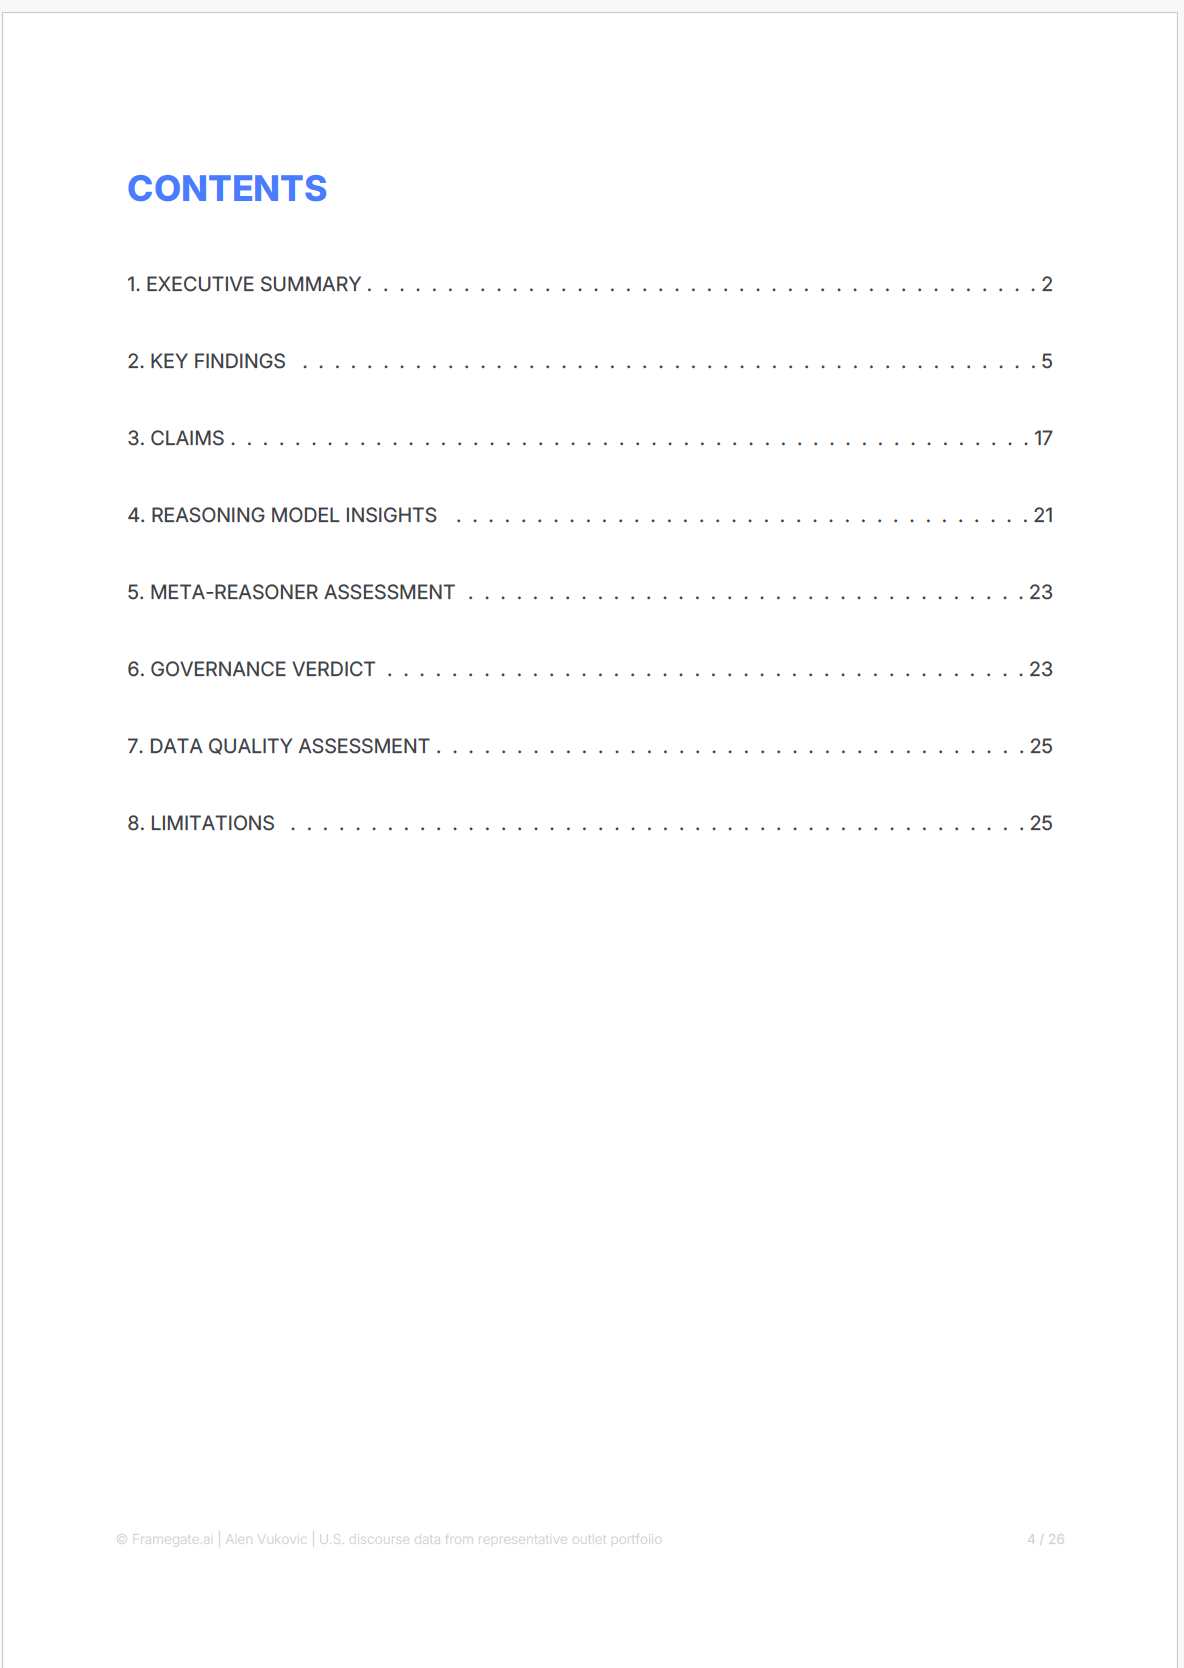
The report follows a fixed analytical structure with 8 sections. Each section serves a distinct function in the evidence chain — from summary through findings and claims to self-assessment and stated limitations.
The 8 sections reflect the pipeline's analytical logic:
1. Executive Summary condenses the verdict, the core findings, and the governance recommendation into a single page. It states whether the thesis is supported, partially supported, or not supported — and under what conditions.
2. Key Findings presents the empirical results: statistical tests, effect sizes, confidence intervals, and visualizations. Each finding is tied to specific data and methods. This is the evidential core of the report.
3. Claims formalizes findings into structured, auditable statements. Each claim carries an evidence type (quantitative, pattern-based, temporal), a confidence level, and references to the underlying data. Claims are schema-validated before inclusion.
4. Reasoning Model Insights documents how the pipeline interpreted the data — which analytical paths it considered, which alternatives it evaluated, and why it arrived at its conclusions rather than others.
5. Meta-Reasoner Assessment evaluates the quality of the pipeline's own reasoning. It flags internal contradictions, identifies where evidence is thin, and assesses whether the analytical methods were appropriate for the data structure.
6. Governance Verdict is the pipeline's self-assessment: can the findings be published as-is, or are there unresolved issues that require further work? This section determines whether the report receives a PASS, CONDITIONAL PROCEED, or FAIL verdict.
7. Data Quality Assessment reports on the reliability of the underlying data — quality scores per variable, critical-variable identification, and whether data quality constrains any specific finding.
8. Limitations states what the analysis cannot claim, where the evidence is insufficient, and which methodological constraints apply. This section is generated by the pipeline itself, not added post-hoc.
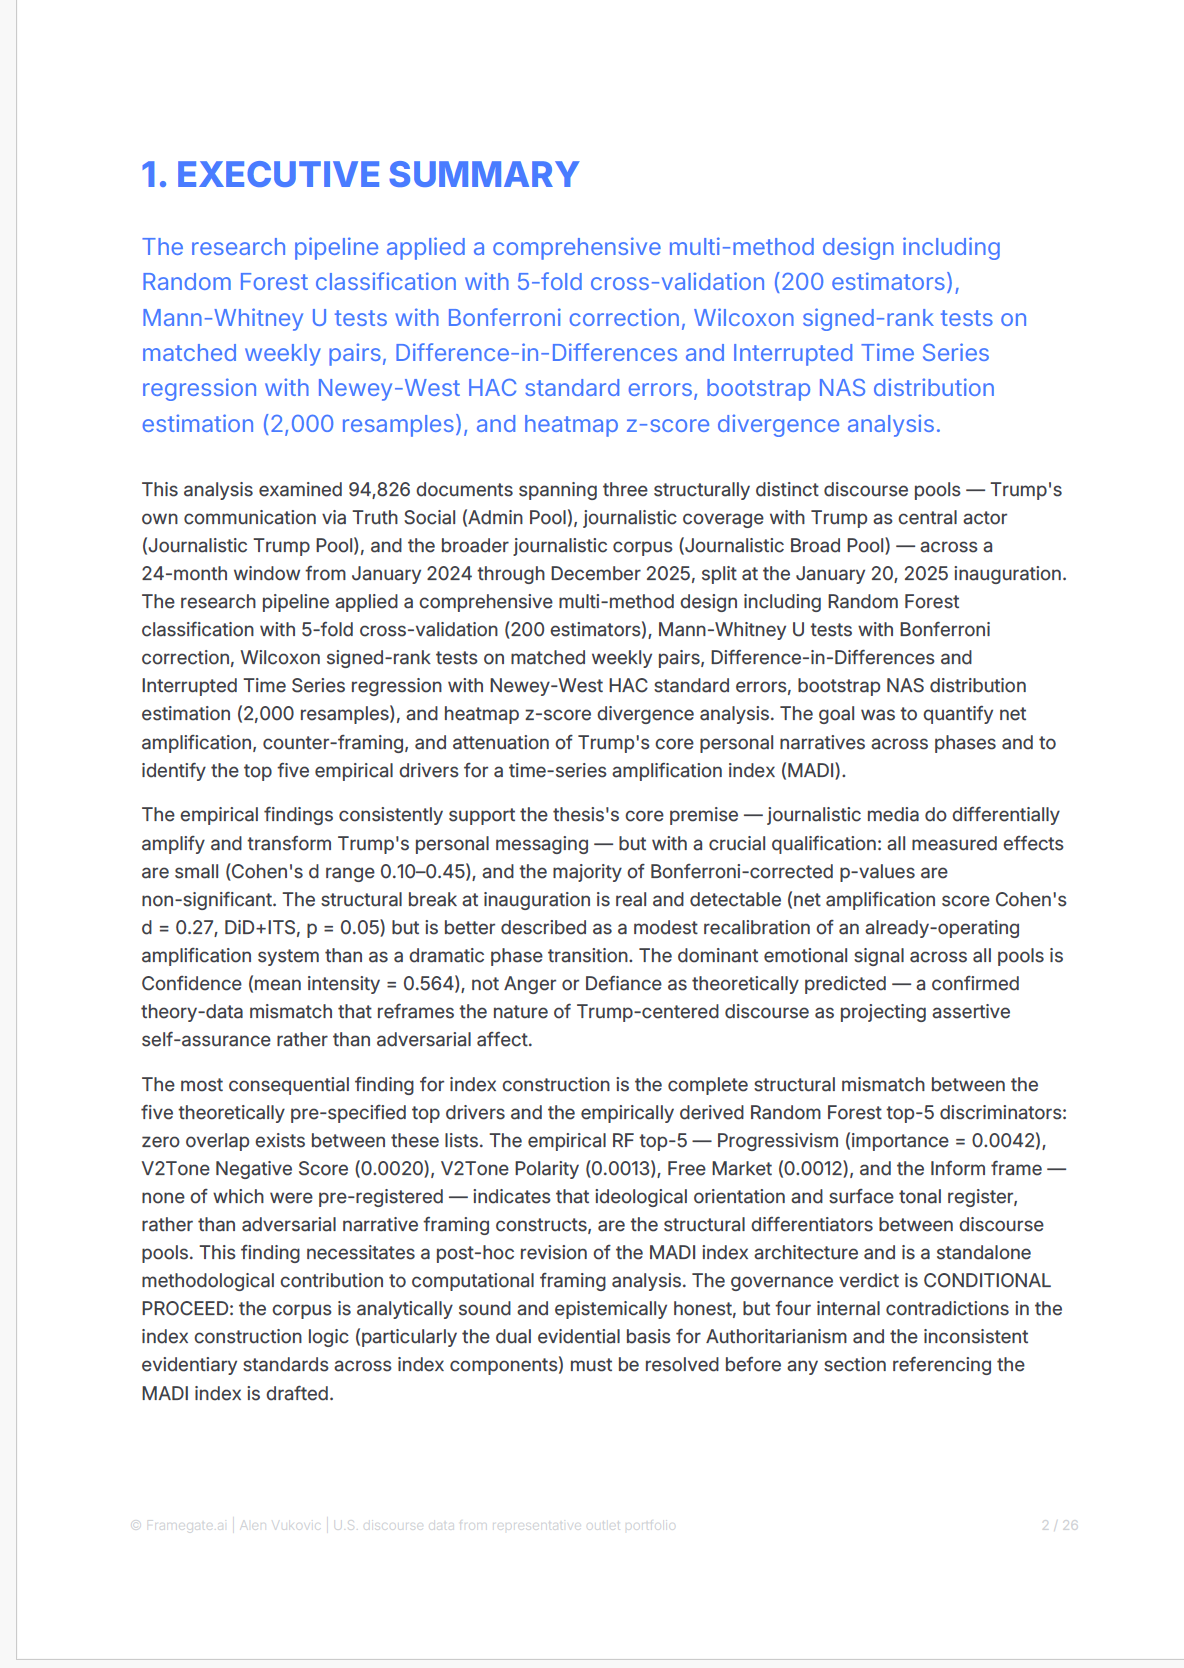
The Executive Summary of an actual analysis. It documents the multi-method design (Random Forest, Wilcoxon, DiD+ITS, bootstrap NAS), the corpus scope (94,826 documents, three discourse pools), the verdict (partially supported), and the key empirical findings — including effect sizes, significance levels, and the governance recommendation.
The entire report — from cover to limitations — is produced by the pipeline without manual intervention. The same verified source text feeds both the PDF and the HTML article published on the research website. Additional output formats (Excel summary tables, JSON data exports, Parquet files) can be generated from the same data foundation on request.
Download Full Report (PDF, 26 pages)
How Does FRAMEGATE Collect and Process Data?
The data foundation consists of 4 distinct pools. Each pool captures a different layer of political discourse — because understanding how meaning forms in a society requires more than reading the New York Times.
Pool 1: Administrative Communication
This pool captures official government and political communication: Truth Social posts, White House press releases, Executive Orders, official statements, and public addresses. These are the primary signals from power — unfiltered, before any journalist interprets them. When Trump posts on Truth Social at 6 AM, FRAMEGATE captures it as raw data before the first news cycle begins.
Pool 2: Journalistic Texts
The outlet portfolio is curated and scored along multiple dimensions (e.g., ideology, reach, geography, media type). These are not randomly selected. Portfolio distributions are documented in the source registry and can be summarized per analysis run. The portfolio is balanced across 5 dimensions:
Ideological balance reflects the actual American media spectrum: the majority of outlets fall in the center or lean moderately, with a smaller proportion representing more pronounced positions — included in controlled proportions to map the full discourse without overweighting fringe voices. Exact distributions are documented in the source registry.
Geographic coverage ensures all 50 U.S. states are represented. Each outlet carries a penetration score reflecting its reach in individual states. The analysis is not dominated by New York and Washington.
The urban-rural divide — one of the most important fault lines in American public opinion — is explicitly captured through a weighted urbanity score. Metropolitan and rural voices flow in proportionally.
Media type diversity spans traditional news organizations, established think tanks, investigative outlets, and regional papers. The full ecosystem, not just the top 10 names everyone knows.
Reach calibration uses a log-scaled scoring system that balances national giants with regional influencers. Neither the New York Times nor Fox News dominates — but their weight is appropriately accounted for.
Pool 3: Podcasts and News Creators
60 political podcasts and news creators capture what you might call the kitchen-table layer of discourse. These are the voices people listen to while commuting, cooking, or scrolling before bed. They discuss politics in long form — nuanced, opinionated, conversational. They fill the credibility gap created by declining trust in traditional media. When a Substack author with 200,000 subscribers reframes a policy debate, that reframing reaches an audience that no editorial board controls.
Pool 4: Comments and Reactions
Public reactions on platforms like X and Truth Social function as a discourse barometer. They do not set narratives — but they reveal how narratives land, which frames trigger emotional responses, and where polarization accelerates. In this framework, platform content is treated primarily as a distribution and reaction signal. Depending on the use case, it can be included as secondary input rather than as the primary evidence base. This pool is used as signal input, not as primary source.
The Process: From Raw Data to Validated Intelligence
The journey from raw text to evidence-based intelligence follows a strict sequence:
Step 1 — Collection. Texts are systematically gathered from all 4 pools. Every source is timestamped, categorized, and stored in structured Parquet format.
Step 2 — Structuring. Each text is parsed and prepared for analysis. Metadata is extracted: source, date, author, outlet ideology, geographic reach, media type.
Step 3 — Analysis. Every text passes through 25 analytical categories comprising 461 individual metrics. These categories range from surface-level content (keywords, topics, article focus) through political structure (bias, ideology, conflict lines, call-to-action) and narrative architecture (framing, causality, semantic structure) to deep psychological layers (emotions, moral foundations, polyvagal markers, Big Five personality indicators, motivation theory).
Step 4 — Quality Assurance. This is where FRAMEGATE fundamentally differs from any other system. A multi-layered verification pipeline is designed to detect and prevent fabricated data, corrupted analysis, and unsupported findings from reaching the output. Details in the next section.
Step 5 — Validation. The system evaluates test–retest stability across repeated runs over time. Depending on metric type, appropriate agreement measures are computed. Threshold definitions and results are documented in the validation appendix.
Step 6 — Output. Results are delivered in whatever format the client needs: PDF reports for board meetings, PowerPoint decks for campaign briefings, JSON files for data teams and machine learning pipelines, Parquet and CSV files for analysts who want raw data, Excel spreadsheets for quick reviews, or publish-ready HTML for web publication. All from the same validated data foundation.
Why Does FRAMEGATE Not Hallucinate?
This is perhaps the most important question anyone can ask about an AI-powered analytical system. And the answer is architectural, not aspirational.
Most AI systems generate text by predicting what sounds plausible. They have no ground truth. They have no data to check against. They produce fluent, confident-sounding output that may or may not reflect reality. That is hallucination — and it is the default behavior of large language models.
FRAMEGATE is designed to reduce hallucination risk through constrained generation and verification gates. Not through a disclaimer. Through engineering.
Layer 1: Data Ground Truth Injection
When the analytical pipeline processes a thesis, the actual calculated values from the database are intended to be injected directly into every step that involves interpretation. Numeric values are injected from computed artifacts (data bundles) rather than generated. Deterministic checks can compare reported numbers against source tables. The data comes first. The interpretation follows.
Layer 2: Decision Points That Stop the Pipeline
The pipeline includes decision gates that can stop execution if specified checks fail; these events are recorded in telemetry. At critical junctures, only PASS or FAIL is allowed. No warnings. No "close enough." If a verification step detects a mismatch between the AI's interpretation and the actual data values, the pipeline is designed to stop. No further analysis is produced until the issue is resolved. This is not a soft guard. It is a hard gate.
Layer 3: 35 Deterministic Steps Without AI
A substantial portion of the pipeline steps are completely deterministic — they run without any AI involvement. Zero interpretation. Pure computation: data loading, statistical calculation, schema validation, file integrity checks, plot generation verification, and publication safety screening. These steps do not involve generative models, so LLM hallucination risk is not present at those stages.
Layer 4: Schema Validation Before Every Write
Before any AI-generated result is saved, it passes through JSON Schema validation. If the output structure does not match the expected schema — wrong data types, missing fields, invalid values — the step fails. Schema validation prevents a defined class of structural output errors from being persisted.
Layer 5: 12-Gate Visualization Verification
Every chart and visualization passes through a 12-gate verification pipeline. This includes code security analysis, sandboxed execution, data fidelity checks that compare rendered chart values against source data within configured tolerances, and multimodal visual review. Visualization checks can compare plotted values against source tables; failures block publication.
When LIZ reports an effect (e.g., "Confidence ranks highest under metric X in pool Y during window Z"), the statement is intended to be backed by the underlying tables and the validation protocol. Where reliability thresholds are met, they are reported; where they are not, caveats are included. It is not a guess. It is not an approximation. It is a measurement tied to computed artifacts.
How Deep Does LIZ Think?
Not every question requires the same depth of analysis. A campaign manager who needs a quick status check on narrative momentum needs a different level of thinking than a think tank director preparing a 50-page policy brief.
FRAMEGATE can operate at multiple levels of analytical depth, from descriptive summaries to comparative inference and robustness-aware interpretation. Think of them as 6 floors of increasing sophistication.
Floors 1 and 2: Description
"What do the data show?" LIZ reads the data, identifies the key numbers, and presents them clearly. Frequencies, distributions, rankings. This is the foundation — accurate, fast, and sufficient for status checks and quick briefings. Like a junior analyst who reads a table and summarizes it correctly.
Floors 3 and 4: Analytical Depth
"What patterns exist, and what do they mean?" LIZ applies statistical methods, identifies correlations, detects anomalies, compares time periods, and maps structural relationships. She does not just show you that confidence is the dominant emotion — she shows you that it increased by 23% between Q3 and Q4 2025, correlates with specific policy events, and diverges from the pattern in journalistic coverage. Like a senior analyst with methodological expertise who sees what the numbers imply.
Floors 5 and 6: Strategic Intelligence
"What does this mean for decisions, and what should be considered?" This is where LIZ operates at the highest analytical depth. She has methodological competence. She can think in multiple directions simultaneously. She evaluates the quality of her own methods. She establishes quality criteria. She delivers evidence-based results and anticipates counter-arguments. Where decision implications are discussed, they are framed as scenario-relevant considerations rather than prescriptive recommendations, with explicit confidence levels, caveats for data quality limitations, and alternative interpretations.
At Floor 5 and 6, LIZ does not just tell you what the data shows. She tells you what it means for your specific situation, what risks you should consider, what the strongest counter-argument would be, and where the evidence is strong enough to act on — and where it is not.
A human consultant carries all of this in their head. LIZ carries the same — but she applies it to 93,000 texts simultaneously, reproduces it identically every time, operates without fatigue or political bias, and documents every step so you can verify how she reached her conclusions.
What Do Clients Actually Get?
Decision-makers do not buy data. They do not buy metrics. They do not buy dashboards. They buy 4 things:
Time Advantage — Early Warning
You see narrative shifts before they appear in polls. When an interpretive frame begins to tip — when a previously fringe position starts appearing in mainstream outlets, when emotional intensity around a topic spikes across 3 or more ideological clusters simultaneously — LIZ detects it. Not because she predicts the future. Because she reads everything, every day, and sees the structural patterns that human readers miss when they follow 20 sources instead of 337. In some cases, aggregated discourse indicators may surface shifts earlier than manual monitoring. Quantifying typical lead times requires systematic backtesting and is treated as an ongoing evaluation objective.
Risk Reduction
Reputational risks and policy risks become visible earlier. The CEO who steps into a press conference without knowing which narrative minefield surrounds their topic — that does not happen with FRAMEGATE. LIZ shows you the active conflict lines, the emotional escalation dynamics, the polarization patterns around your specific issue. Before you speak, you know what you are speaking into.
Actionability — Concrete Artifacts
No abstract dashboards. No "interesting insights" without next steps. FRAMEGATE delivers concrete, usable artifacts: a PDF report you take into the board meeting, a PowerPoint deck for the campaign briefing, a JSON file for your data science team, a CSV export for your analyst, a publish-ready HTML article for your website. Every output is formatted for immediate use — briefing-ready, citation-ready, decision-ready.
Better Internal Communication
When your CEO, your PR team, your policy analyst, and your campaign manager all work from the same validated data foundation, they speak the same language. No more conflicting interpretations based on different news sources. No more "I read somewhere that..." versus "our data shows..." FRAMEGATE creates a shared evidence base that makes internal alignment possible — consistently, across teams, across time zones.
What Roles Can LIZ Play?
LIZ is not one tool. She is an analysis interface that adapts her output format and depth to whoever is asking. The same engine, the same data, the same validation — but a different conversation depending on what you need.
For Campaign Managers: Research Assistant and Strategy Advisor
"Which narratives are gaining momentum right now? Where is the flanking opportunity? Which framing works in which region? How did the discourse around immigration shift in the last 14 days — and what does that mean for our messaging in Arizona versus Pennsylvania?" LIZ delivers campaign-relevant intelligence with regional granularity, emotional mapping, and competitive framing analysis. Not opinions. Patterns.
For Think Tanks: Database and Analysis Engine
"We need a systematic analysis of how climate policy framing evolved across 337 outlets between January 2024 and February 2026. Reproducible. Citable. With statistical confidence intervals." LIZ delivers exactly that — 93,000+ texts systematically evaluated, methodologically documented, ready for policy papers and academic citation. Every finding traceable to source data.
For CEOs and Board Members: Early Warning System and PR Strategist
"I am giving a keynote on U.S. trade policy next week. What is the current narrative climate? How will my positioning be read? Where are the risks?" LIZ maps the active discourse field around your topic, identifies which interpretive frames dominate, shows you the emotional intensity and polarization levels, and helps you formulate positions that remain factual without inadvertently appearing partisan.
A European CEO wants to comment on U.S. trade policy. LIZ shows, based on 22 months of coverage across 337 outlets: Since November 2024, GOP positions dominate the economic agenda. Technical language about tariffs or deregulation is read within a GOP-framed context — whether intended or not. The CEO receives an evidence-based assessment of the narrative environment and can adjust their communication accordingly.
For Journalists: Story Finder and Newsroom Assistant
"What stories are hiding in the data that nobody has told yet? Where are the patterns that 20 journalists reading 20 different sources would never see?" LIZ finds the stories that only become visible at scale: the slow-building trends, the counter-intuitive correlations, the regional divergences that national coverage misses. Data-driven investigative leads, not hunches.
For PR Strategists: Positioning Advisor and Campaign Analyst
"How is the narrative field moving around our client's topic? Where is there space for our message? Which frames are already occupied, and by whom?" LIZ shows you the competitive landscape of meaning — not market share, but narrative share. Who is setting the frames, who is amplifying them, and where the openings are for your client's positioning.
What Output Formats Are Available?
FRAMEGATE does not lock you into a single format. The same validated data foundation produces whatever your workflow requires:
PDF Reports — publication-quality documents with charts, findings, and executive summaries. Ready for board meetings, investor briefings, and stakeholder presentations.
PowerPoint Decks — slide-ready presentations with key findings, visualizations, and talking points. Ready to present without reformatting.
JSON Files — machine-readable structured data for data science teams, API integrations, and automated pipelines.
Parquet and CSV — raw analytical data for analysts who want to run their own queries, build their own models, or integrate with existing tools.
Excel Spreadsheets — sortable, filterable data tables for quick reviews and ad-hoc analysis.
HTML Articles — publish-ready web content with responsive design, embedded visualizations, and SEO metadata. Ready to deploy on any website.
How Is the Analysis Scientifically Validated?
Validation is not a feature of FRAMEGATE. It is the foundation.
The methodology employs kappa-family measures — a widely used approach for measuring inter-rater reliability in scientific research, originally developed by Joseph Fleiss in 1971. The concept is straightforward: if multiple independent raters analyze the same material and arrive at the same conclusions, the measurement is reliable. If they disagree, it is not.
FRAMEGATE adapted this principle for AI-augmented analysis. The system evaluates test–retest stability across repeated runs over time. Depending on metric type, appropriate agreement measures are computed (e.g., kappa-family measures for categorical outputs, correlation-based measures for continuous variables). If the system produces consistent analytical results for the same text across runs, the measurement is reliable.
The results: a large majority of categorical fields exceed pre-defined agreement thresholds (e.g., κ ≥ 0.75). Threshold definitions, distributions, and weighting schemes are documented in the validation appendix.
Operational reliability is monitored via pipeline throughput and failure rates; quality gates enforce pass/fail criteria at each stage.
The validation encompasses multiple layers: tolerance tests for numerical values, correlation analyses between months, classical Fleiss' Kappa calculation for categorical data, and separate analyses for complex mixed structures. The system identifies unstable components and validates production readiness against scientific reference values (Landis & Koch, 1977).
What Specialized Analysis Families Does FRAMEGATE Offer?
Beyond the 25 standard categories, FRAMEGATE offers specialized analysis families that enable deeper strategic insights:
Narrative Laundering reveals how narratives migrate from think tanks through elites into the mainstream — a process rarely visible, yet one that fundamentally shapes discourse.
The Narrative Suppression Index captures which controversial topics systematically disappear from coverage — what is not said can be just as decision-relevant as what is said.
Narrative Velocity and Momentum measure how quickly frames spread and gain traction. When a new keyword appears in high-reliability outlets, mainstream media typically pick it up within 36 hours.
Regional Penetration and Urban-Rural Divide show which narratives dominate in which regions and milieus — critical for targeting in campaigns and regional communication.
The Power-Player Map identifies which outlets set frames (frame-setters) and which amplify them (amplifiers) — central to the question of where communication should be placed first.
What Published Research Exists?
FRAMEGATE is not a promise. It produces results. Here are published analyses available on this website:
U.S. Discourse Dynamics
Confidence as Dominant Emotion — a quantitative analysis of emotional patterns in Trump's Truth Social posts, examining whether confidence dominates the emotional spectrum in 2025 political communication.
Polarization and Ideological Drift
The 4× Gap — an analysis of how Trump's communications outpaced journalistic response by a factor of 4, measured across 16 ideology dimensions and 93,500 articles.
Presidential and Partisan Playbooks
Journalistic Amplification of Trump’s Messaging — a multi-method analysis of 94,826 documents across three discourse pools (Truth Social, Trump-centric journalism, broad journalism) quantifying amplification, counter-framing, and attenuation of Trump’s core personal narratives across pre- and post-inauguration phases.
These are not previews or mockups. They are analyses published with documented methods, results tables, and stated limitations — produced by the FRAMEGATE engine and delivered through LIZ.
What Questions Do Think Tanks Ask About FRAMEGATE?
Can I trace every finding back to its original source?
Yes. Every analysis LIZ produces includes source references down to the outlet level. When you run an analysis, you see exactly which outlets, podcasts, or news creators contributed to the result. FRAMEGATE operates exclusively on 337 curated and legally acquired media sources and 60 podcasts — every single one traceable, every single one editorially verified before inclusion.
Can I access the raw data behind an analysis?
Yes — per analysis. When LIZ runs a thesis through the pipeline, the raw data underlying that specific analysis is available. You can request it in multiple formats: JSON, CSV, Parquet, or Excel. However, the raw data of the entire FRAMEGATE engine — the full database across all 93,000+ texts — is not accessible. That is proprietary infrastructure. What you get is complete transparency for your specific research question.
Does the methodology meet academic standards for reproducibility?
Yes. Every analysis runs through a deterministic multi-step pipeline with a substantial portion of purely deterministic steps (zero AI involvement), schema validation, and full telemetry logging. Method choices are informed by established literature in framing, political psychology, and computational social science (bibliography available). Where human benchmarking is conducted, study design and agreement metrics are reported.
Can I publish results from a FRAMEGATE analysis?
Yes. Sources are acquired and processed under the project's licensing and compliance framework. You may publish results from your analysis with the attribution "Generated by framegate.ai" and the corresponding citation. Publication and attribution rules are specified per engagement. LIZ can generate the citation block for you automatically in whatever format your institution requires.
Which market does FRAMEGATE currently cover?
Currently the United States. The U.S. is the largest media market globally, and for European decision-makers it remains the market whose leading narratives most strongly shape the discourse on the European continent. Understanding what establishes itself in American political communication today means understanding what arrives in European boardrooms, newsrooms, and parliaments tomorrow.
Can I see the full list of metrics, outlets, and podcasts in the system?
Not in full scope. The complete outlet pool, podcast roster, and the 461 individual metrics are proprietary — as is the scoring methodology and the representative weighting system behind the data. These are trade secrets that protect the integrity and competitive advantage of the engine. However, in every individual analysis, you see exactly which outlets and metrics were used for that specific result. Transparency per analysis — confidentiality for the engine architecture.
What Questions Do Journalists Ask About FRAMEGATE?
Can I build my own story from a FRAMEGATE analysis?
Absolutely. That is one of the core use cases. LIZ functions as a research assistant who navigates 93,000+ texts for you, surfaces patterns you would never find by reading individual articles, and delivers structured findings you can use as the evidence foundation for your own reporting. The story is yours — the data backbone comes from FRAMEGATE.
How do I verify that the sources are legitimate?
Every source in the FRAMEGATE database has been legally acquired and editorially verified. All 337 media outlets and 60 podcasts are curated — meaning each one was individually assessed for editorial standards, publication regularity, and relevance to U.S. political discourse before inclusion. LIZ does not scrape the internet. She references only from this curated pool. Corpus-constrained sourcing is an architectural constraint, not a marketing claim.
Can I trace a specific claim back to the original text?
Yes. When LIZ generates claims as part of an analysis, each claim carries an evidence type marker (quantitative, pattern-based, temporal) and references the data points it was derived from. You see outlet names, time periods, and the specific metrics involved. This is not a black box — it is a glass box with a locked engine room.
Am I allowed to publish what LIZ delivers?
Yes. You can publish analysis results with the attribution "Generated by framegate.ai" and the appropriate citation. Publication and attribution rules are specified per engagement. LIZ can generate the citation automatically for you.
Does FRAMEGATE replace my own research?
No. FRAMEGATE replaces the part of research that is humanly impossible at scale: reading 93,000 texts, cross-referencing 461 metrics, tracking narrative shifts across 337 sources over three years. What it gives you is a structured, evidence-based starting point — patterns, anomalies, tipping points, and counter-narratives you would never find in a week of manual research. Your editorial judgment, your angle, your story — that remains entirely yours.
How current is the data for breaking stories?
The database covers December 2022 through February 2026 and grows continuously as new content is published across all 337 sources and 60 podcasts. FRAMEGATE is not a real-time wire service — it is a depth engine. It shows you how today's breaking story connects to discourse patterns that have been building for months or years. That context is what makes the difference between a reactive headline and an informed analysis.
What Questions Do Campaign Teams Ask About FRAMEGATE?
How fast can I get results?
A full FRAMEGATE analysis runs through the 93-step pipeline in minutes, not days. LIZ delivers structured findings, validated claims, statistical evidence, and publication-ready outputs in a single dialogue session. The time advantage is the first of four core value propositions: while your competition is still briefing their analysts, you already have evidence-based insights on your desk.
Can FRAMEGATE reduce the risk of strategic miscalculation?
That is the second core value proposition: risk reduction. Every finding is backed by quantitative evidence from 93,000+ texts, not by gut feeling or selective reading. LIZ shows you not only what supports your hypothesis, but explicitly surfaces counter-evidence and alternative interpretations. You see the full picture before you commit resources — including the narratives your opposition is building.
Does FRAMEGATE help me act, or just analyze?
Both — but with a clear priority on actionability. The third value proposition is operational capability. LIZ does not deliver a 200-page report that collects dust. She delivers targeted findings, specific claims with evidence strength ratings, and concrete patterns you can translate into messaging, positioning, or counter-narrative strategy within hours. The thinking depths go up to Floor 6: strategic recommendations with scenario modeling.
Can I use the results for internal team communication?
Yes — and that is the fourth value proposition: better internal communication. LIZ delivers results in whatever format your team needs: a 2-page PDF briefing for the executive, a detailed PowerPoint for the strategy meeting, raw data in Excel for the analytics team, or a structured JSON feed for your own tools. Everyone gets the same evidence base, adapted to their workflow. No more "but I read somewhere that..." — instead: "the data across 337 sources shows that..."
Can I get a test phase before committing?
Yes. We offer test phases — including in the form of publishing partnerships or research partnerships where we produce a co-branded analysis together. This lets you see exactly what FRAMEGATE delivers before any long-term commitment. We are currently in the MVP phase and actively seeking partners who want to explore what evidence-based discourse intelligence can do for their work.
What does FRAMEGATE cost?
Pricing is discussed in a personal conversation. Every use case is different — a campaign team running weekly narrative monitoring has different needs than a think tank commissioning a single deep-dive analysis. We tailor the engagement to your specific requirements. Reach out, and we will find a model that works.
What Questions Do CEOs and Communications Leaders Ask About FRAMEGATE?
How does FRAMEGATE protect the confidentiality of my inquiries?
Every analysis runs in an isolated vault — a self-contained directory with its own data bundle, telemetry log, and artifact registry. Your research question, your results, and your strategic direction never leave that vault. There is no shared database of client queries, no cross-pollination of insights between users, and no data retention beyond what you explicitly authorize.
Are all sources in the database legally acquired?
Yes. Every single one of the 337 media outlets, 60 podcasts, and all associated texts has been legally acquired through proper channels. Sources are acquired and processed under the project's licensing and compliance framework — no scraping, no gray-area data harvesting. This is not a compliance footnote. It is a foundational design principle.
Can I see which outlets and metrics are in the system before commissioning an analysis?
Not in full scope. The complete outlet roster, the 461 metrics catalog, and the scoring and representative weighting methodology are trade secrets — they represent the core intellectual property of the FRAMEGATE engine. However, within every individual analysis, full transparency applies: you see exactly which outlets contributed to the result, which metrics were evaluated, and how the findings were derived. Transparency per engagement — confidentiality for the engine.
How can my organization access FRAMEGATE?
We are currently in the MVP phase. We welcome every inquiry from decision-makers who have a concrete research question or strategic need. We are developing further every day, and every contact is valuable to us — because we learn from every engagement. Reach out with your use case. We will find ways to collaborate, whether through a single analysis, a test phase, a research partnership, or an ongoing advisory arrangement.
What is the ROI of using FRAMEGATE over traditional research methods?
The ROI comes from four dimensions: time advantage (minutes instead of weeks), risk reduction (evidence instead of intuition), operational capability (actionable findings instead of abstract reports), and better internal communication (one evidence base for the entire organization). A single FRAMEGATE analysis covers more ground than a team of analysts could in a month — and it does so with statistical validation that manual research cannot achieve at this scale.
Does FRAMEGATE work for European markets or only the United States?
Currently the engine covers the U.S. market exclusively. The United States is the largest media market globally, and for European decision-makers it is the market whose leading narratives most directly shape discourse on the European continent. What establishes itself in American political communication today defines the conversation in European boardrooms, newsrooms, and parliaments tomorrow. Understanding the U.S. discourse architecture is not an American concern — it is a transatlantic necessity.
Can we co-brand a FRAMEGATE analysis for public release?
Yes. We actively offer co-branding partnerships, particularly for publishing partnerships and research collaborations. A co-branded analysis carries your organization's name alongside the FRAMEGATE attribution — giving you a credible, data-backed publication while demonstrating thought leadership. This is one of our preferred engagement models during the MVP phase.
Frequently Asked Questions About FRAMEGATE and LIZ
What exactly does FRAMEGATE analyze?
FRAMEGATE analyzes how meaning forms in the U.S. media and political landscape. It examines frames, narratives, conflict lines, emotional markers, escalation patterns, ideological positioning, and psychological depth structures — across 461 metrics in 25 categories, based on over 93,000 texts from 337 media sources and 60 podcasts, covering December 2022 through February 2026.
Who is LIZ?
LIZ is the dialogue interface to the FRAMEGATE engine. She is an analysis interface that adapts to your role: research assistant for campaign teams, analysis engine for think tanks, early warning system for CEOs, story finder for journalists, positioning advisor for PR strategists. She is designed to deliver results from the curated corpus with multiple verification steps — constrained to the curated media outlets and podcasts.
Can I explore the data freely?
There are no predefined reports, dashboards, or standard templates. LIZ is a dialogue interface — you ask your question, and she navigates the full database to deliver exactly what you need. Every analysis is client-oriented. You can explore any dimension, any time period, any combination of variables. The output format adapts to your needs: PDF, PowerPoint, JSON, Excel, CSV, Parquet, or HTML.
Why does FRAMEGATE not use social media platforms as primary sources?
Platforms like X, Facebook, or TikTok are distribution channels, not editorial entities. A post only becomes decision-relevant when media outlets or news creators frame it. FRAMEGATE analyzes where meaning actually originates — not where it is merely distributed. Platform reactions are used as signal input, not as source data.
How does FRAMEGATE differ from media monitoring?
Media monitoring answers: "What is being said?" FRAMEGATE answers: "What is establishing itself as the dominant interpretive frame — and why now?" It does not count mentions. It maps the architecture of meaning: which frames gain traction, how conflict lines harden, when narratives shift from background noise to decision-relevant reality.
Does FRAMEGATE replace human judgment?
No. FRAMEGATE removes the fog around discourse so that human judgment can operate on a transparent, evidence-based foundation. LIZ does not tell you what to decide. She shows you what the data says, what patterns exist, what risks are visible, and what the strongest counter-arguments would be. The decision remains yours — but it is now informed by 93,000 texts instead of 20 headlines.
How current is the data?
The database covers December 2022 through February 2026 and grows continuously. New texts are added from all 337 sources and 60 podcasts as they are published.
FRAMEGATE exists because in an era of accelerating polarization, reading 20 newspapers is no longer enough to understand how political discourse actually works. The engine analyzes over 93,000 texts from 337 curated sources across 461 validated metrics — and LIZ makes that intelligence accessible through natural dialogue, adapted to your role, delivered in your format. Not opinions. Not impressions. Evidence — reproducible and traceable by design, with reliability results reported per metric and per release. For decision-makers who do not want to react faster, but see earlier.
Scientific Sources
I. Psychological Models and Motivation
- Schwartz, S. H. (1992). Universals in the content and structure of values. Advances in Experimental Social Psychology, 25, 1-65.
- Schwartz, S. H. (2012). An overview of the Schwartz theory of basic values. Online Readings in Psychology and Culture, 2(1).
- Haidt, J. (2012). The Righteous Mind: Why Good People Are Divided by Politics and Religion. Vintage Books.
- Graham, J., Haidt, J., & Nosek, B. A. (2009). Liberals and conservatives rely on different sets of moral foundations. Journal of Personality and Social Psychology, 96(5), 1029-1046.
- Deci, E. L., & Ryan, R. M. (1985). Intrinsic Motivation and Self-Determination in Human Behavior. Plenum Press.
- Ryan, R. M., & Deci, E. L. (2000). Self-determination theory and the facilitation of intrinsic motivation. American Psychologist, 55(1), 68-78.
- Higgins, E. T. (1997). Beyond pleasure and pain. American Psychologist, 52(12), 1280-1300.
- Higgins, E. T. (1998). Promotion and prevention: Regulatory focus as a motivational principle. Advances in Experimental Social Psychology, 30, 1-46.
- McClelland, D. C. (1975). Power: The Inner Experience. Irvington.
- Winter, D. G. (1973). The Power Motive. Free Press.
- Vroom, V. H. (1964). Work and Motivation. Wiley.
- Rogers, R. W. (1975). A protection motivation theory of fear appeals and attitude change. Journal of Psychology, 91(1), 93-114.
- Hobfoll, S. E. (1989). Conservation of resources: A new attempt at conceptualizing stress. American Psychologist, 44(3), 513-524.
- Costa, P. T., & McCrae, R. R. (1992). Revised NEO Personality Inventory (NEO-PI-R). Psychological Assessment Resources.
- Goldberg, L. R. (1990). An alternative "description of personality": The Big-Five factor structure. Journal of Personality and Social Psychology, 59(6), 1216-1229.
- Elliot, A. J. (2006). The hierarchical model of approach-avoidance motivation. Motivation and Emotion, 30(2), 111-116.
- Porges, S. W. (2011). The Polyvagal Theory. W.W. Norton.
- Porges, S. W. (2007). The polyvagal perspective. Biological Psychology, 74(2), 116-143.
II. Framing and Political Communication
- Entman, R. M. (1993). Framing: Toward clarification of a fractured paradigm. Journal of Communication, 43(4), 51-58.
- Entman, R. M. (2004). Projections of Power: Framing News, Public Opinion, and U.S. Foreign Policy. University of Chicago Press.
- Lakoff, G. (2004). Don't Think of an Elephant! Know Your Values and Frame the Debate. Chelsea Green.
- Lakoff, G. (2002). Moral Politics: How Liberals and Conservatives Think. University of Chicago Press.
- Lakoff, G. (2008). The Political Mind. Penguin.
- Lakoff, G., & Johnson, M. (1980). Metaphors We Live By. University of Chicago Press.
- Semetko, H. A., & Valkenburg, P. M. (2000). Framing European politics. Journal of Communication, 50(2), 93-109.
- de Vreese, C. H. (2005). News framing: Theory and typology. Information Design Journal, 13(1), 51-62.
- McCombs, M. E., & Shaw, D. L. (1972). The agenda-setting function of mass media. Public Opinion Quarterly, 36(2), 176-187.
- McCombs, M. E. (2004). Setting the Agenda. Polity Press.
- Scheufele, D. A., & Tewksbury, D. (2007). Framing, agenda setting, and priming. Journal of Communication, 57(1), 9-20.
- Iyengar, S., & Kinder, D. R. (1987). News That Matters. University of Chicago Press.
III. Persuasion and Rhetoric
- Cialdini, R. B. (1984/2021). Influence: The Psychology of Persuasion. Harper Business.
- Cialdini, R. B. (2016). Pre-Suasion. Simon & Schuster.
- Aristotle. Rhetoric (ca. 350 BCE).
- Cicero. De Oratore (55 BCE).
- Quintilian. Institutio Oratoria (ca. 95 CE).
IV. Mass Psychology and Propaganda
- Le Bon, G. (1895). The Crowd: A Study of the Popular Mind. Dover.
- Le Bon, G. (1912). The Psychology of Revolution. G.P. Putnam's Sons.
- Bernays, E. L. (1928). Propaganda. Horace Liveright.
- Bernays, E. L. (1923). Crystallizing Public Opinion. Boni and Liveright.
- Herman, E. S., & Chomsky, N. (1988). Manufacturing Consent. Pantheon Books.
- Lippmann, W. (1922). Public Opinion. Harcourt, Brace.
- Lippmann, W. (1925). The Phantom Public. Harcourt, Brace.
V. Political Philosophy and Strategy
- Machiavelli, N. (1532). The Prince. Penguin Classics.
- Machiavelli, N. (1531). Discourses on Livy. University of Chicago Press.
- Luntz, F. (2007). Words That Work. Hyperion.
- Westen, D. (2007). The Political Brain. PublicAffairs.
VI. Narratology and Storytelling
- Propp, V. (1928/1968). Morphology of the Folktale. University of Texas Press.
- Campbell, J. (1949). The Hero with a Thousand Faces. New World Library.
- Vogler, C. (1992). The Writer's Journey. Michael Wiese Productions.
- Greimas, A. J. (1966). Structural Semantics. University of Nebraska Press.
VII. Cognitive Psychology
- Kahneman, D. (2011). Thinking, Fast and Slow. Farrar, Straus and Giroux.
- Kahneman, D., & Tversky, A. (1979). Prospect theory. Econometrica, 47(2), 263-291.
- Tversky, A., & Kahneman, D. (1974). Judgment under uncertainty: Heuristics and biases. Science, 185(4157), 1124-1131.
- Gigerenzer, G. (2007). Gut Feelings. Viking.
- Ariely, D. (2008). Predictably Irrational. Harper.
- Thaler, R. H., & Sunstein, C. R. (2008). Nudge. Yale University Press.
VIII. Buddhist Phenomenology
- Bodhi, B. (2000). The Connected Discourses of the Buddha (Samyutta Nikaya). Wisdom Publications.
- Analayo, B. (2003). Satipatthana: The Direct Path to Realization. Windhorse.
- Gethin, R. (1998). The Foundations of Buddhism. Oxford University Press.
IX. AI and Machine Learning
- Mohri, M., Rostamizadeh, A., & Talwalkar, A. (2018). Foundations of Machine Learning. MIT Press.
- Goodfellow, I., Bengio, Y., & Courville, A. (2016). Deep Learning. MIT Press.
- Prince, S. J. D. (2023). Understanding Deep Learning. MIT Press.
- Sutton, R. S., & Barto, A. G. (2018). Reinforcement Learning: An Introduction. MIT Press.
- Bellemare, M. G., Dabney, W., & Rowland, M. (2023). Distributional Reinforcement Learning. MIT Press.
- Murphy, K. P. (2022). Probabilistic Machine Learning: An Introduction. MIT Press.
- Barocas, S., Hardt, M., & Narayanan, A. (2023). Fairness and Machine Learning.
X. Methodology
- Krippendorff, K. (2018). Content Analysis. Sage.
- Neuendorf, K. A. (2017). The Content Analysis Guidebook. Sage.
- Fleiss, J. L. (1971). Measuring nominal scale agreement among many raters. Psychological Bulletin, 76(5), 378-382.
- Jurafsky, D., & Martin, J. H. (2023). Speech and Language Processing.
XI. Additional Classics
- Goffman, E. (1974). Frame Analysis. Harvard University Press.
- Zaller, J. R. (1992). The Nature and Origins of Mass Opinion. Cambridge University Press.
- Gamson, W. A. (1992). Talking Politics. Cambridge University Press.
- Gitlin, T. (1980). The Whole World Is Watching. UC Berkeley Press.
XII. Campaign Communication and Political Strategy
- Ansolabehere, S., & Iyengar, S. (1996). Going Negative: How Political Advertisements Shrink and Polarize the Electorate. Quill Magazine.
- Burton, M. J., & Shea, D. M. Campaign Craft: The Strategies, Tactics, and Art of Political Campaign Management (4th ed.). Praeger.
- Campbell, A., Converse, P. E., Miller, W. E., & Stokes, D. E. (1960). The American Voter. John Wiley & Sons.
- Chong, D., & Druckman, J. N. (2007). Framing Theory. Annual Review of Political Science.
- Christiansen, P. Orchestrating Public Opinion: How Music Persuades in Television Political Ads for US Presidential Campaigns, 1952-2016. Dissertation.
- Di Pace, P. D. (2016). Political Campaign Revolutions: Case Study Barack Obama 2008. University of Luiss Guido Carli (Dissertation).
- Dolezal, M., Ennser-Jedenastik, L., & Müller, W. C. (2015). Who Will Attack the Competitors? How Political Parties Resolve Strategic and Collective Action Dilemmas in Negative Campaigning. Party Politics.
- Druckman, J. N. et al. (2018). Resisting the Opportunity for Change: How Congressional Campaign Insiders Viewed and Used the Web in 2016. Social Science Computer Review.
- Ganz, M. (2009). Organizing Obama: Campaign, Organization, Movement. Harvard Kennedy School.
- Gervais, B. T. (2013). Incivility in Mass Political Discourse: The Causes and Consequences of an Uncivil Public. University of Maryland (Dissertation).
- Halperin, M. Double Down: Game Change 2012. Penguin Press.
- Higdon, N. What is Fake News? A Foundational Question for Developing Effective Critical News Literacy Education. Democratic Communique.
- Iyengar, S., & Krupenkin, M. (2018). The Strengthening of Partisan Affect. Advances in Political Psychology.
- Jamieson, K. H. (1992). Dirty Politics: Deception, Distraction, and Democracy. Oxford University Press.
- Jamieson, K. H. et al. (2015). The Political Uses and Abuses of Civility and Incivility. Oxford Handbook of Political Communication.
- Johnson, B. M. (2024). Running the Country Like a Business: Donald Trump, Neoliberalism, and the Metaphor of the CEO Presidency. Pennsylvania State University (Dissertation).
- Lau, R. R., & Redlawsk, D. P. (2006). How Voters Decide: Information Processing during Election Campaigns. Cambridge University Press.
- Lecheler, S., & de Vreese, C. H. (2019). News Framing Effects: Theory and Practice. Routledge.
- Mayer, J. (2019). The Making of the Fox News White House. The New Yorker.
- Nelson, T. E. Framing of the Welfare Issue. American Political Science Review.
- Petkevič, V., & Nai, A. (2022). Political Attacks in 280 Characters or Less: A New Tool for the Automated Classification of Campaign Negativity on Social Media. American Politics Research.
- Projer, V. M. (2023). Foes or Friends? The Media Communication of Kennedy, Nixon, Obama, and Trump. LMU Munich (Dissertation).
- Redlawsk, D. P. (2004). Motivated Reasoning and Voter Decision Making: Affect and Evaluation. International Society of Political Psychology.
- Rosin, R. E. (2023). Propaganda on Steroids: A Case Study on How Communication Technology "Pumped Up" Russian Black Propaganda. University of Pennsylvania (Dissertation).
- Scott, K. M. (2017). Speaking Up: Down-Ballot Candidate Communication, Clinton, Trump, and the Election that Surprised America. University of Washington (Dissertation).
- Sherman, G. The Loudest Voice in the Room: Roger Ailes and the Rise of Fox News. Random House.
- Swearingen, C. (2011). Is Winning Everything? Why Campaign Consultants Operate in the American Political System. University of Oklahoma (Dissertation).
- Trent, J. S., Friedenberg, R. V., & Denton, R. E., Jr. (2016). Political Campaign Communication: Principles and Practices (8th ed.). Rowman & Littlefield.
- Valentino, N. A., Hutchings, V. L., & Williams, D. (2004). The Impact of Political Advertising on Knowledge, Internet Information Seeking, and Candidate Preference. Journal of Communication.
- Valverde González, A. (2022). From the Ministry of Truth to the Filter Bubble: Manipulation of Discourse in 1984 and The Loudest Voice. Forum for World Literature Studies.
Get Early Access
Interested in early access, partnership, or a briefing?
info@framegate.ai ·
LinkedIn ·
framegate.ai